
Comparing Total Events Against Quarantined Events for a Tool
Work out how much of the sensitive data reaching an AI application was held for review, and how much passed straight through.
You are on the By AI Tool section of the Sensitive Data Exposure tab.
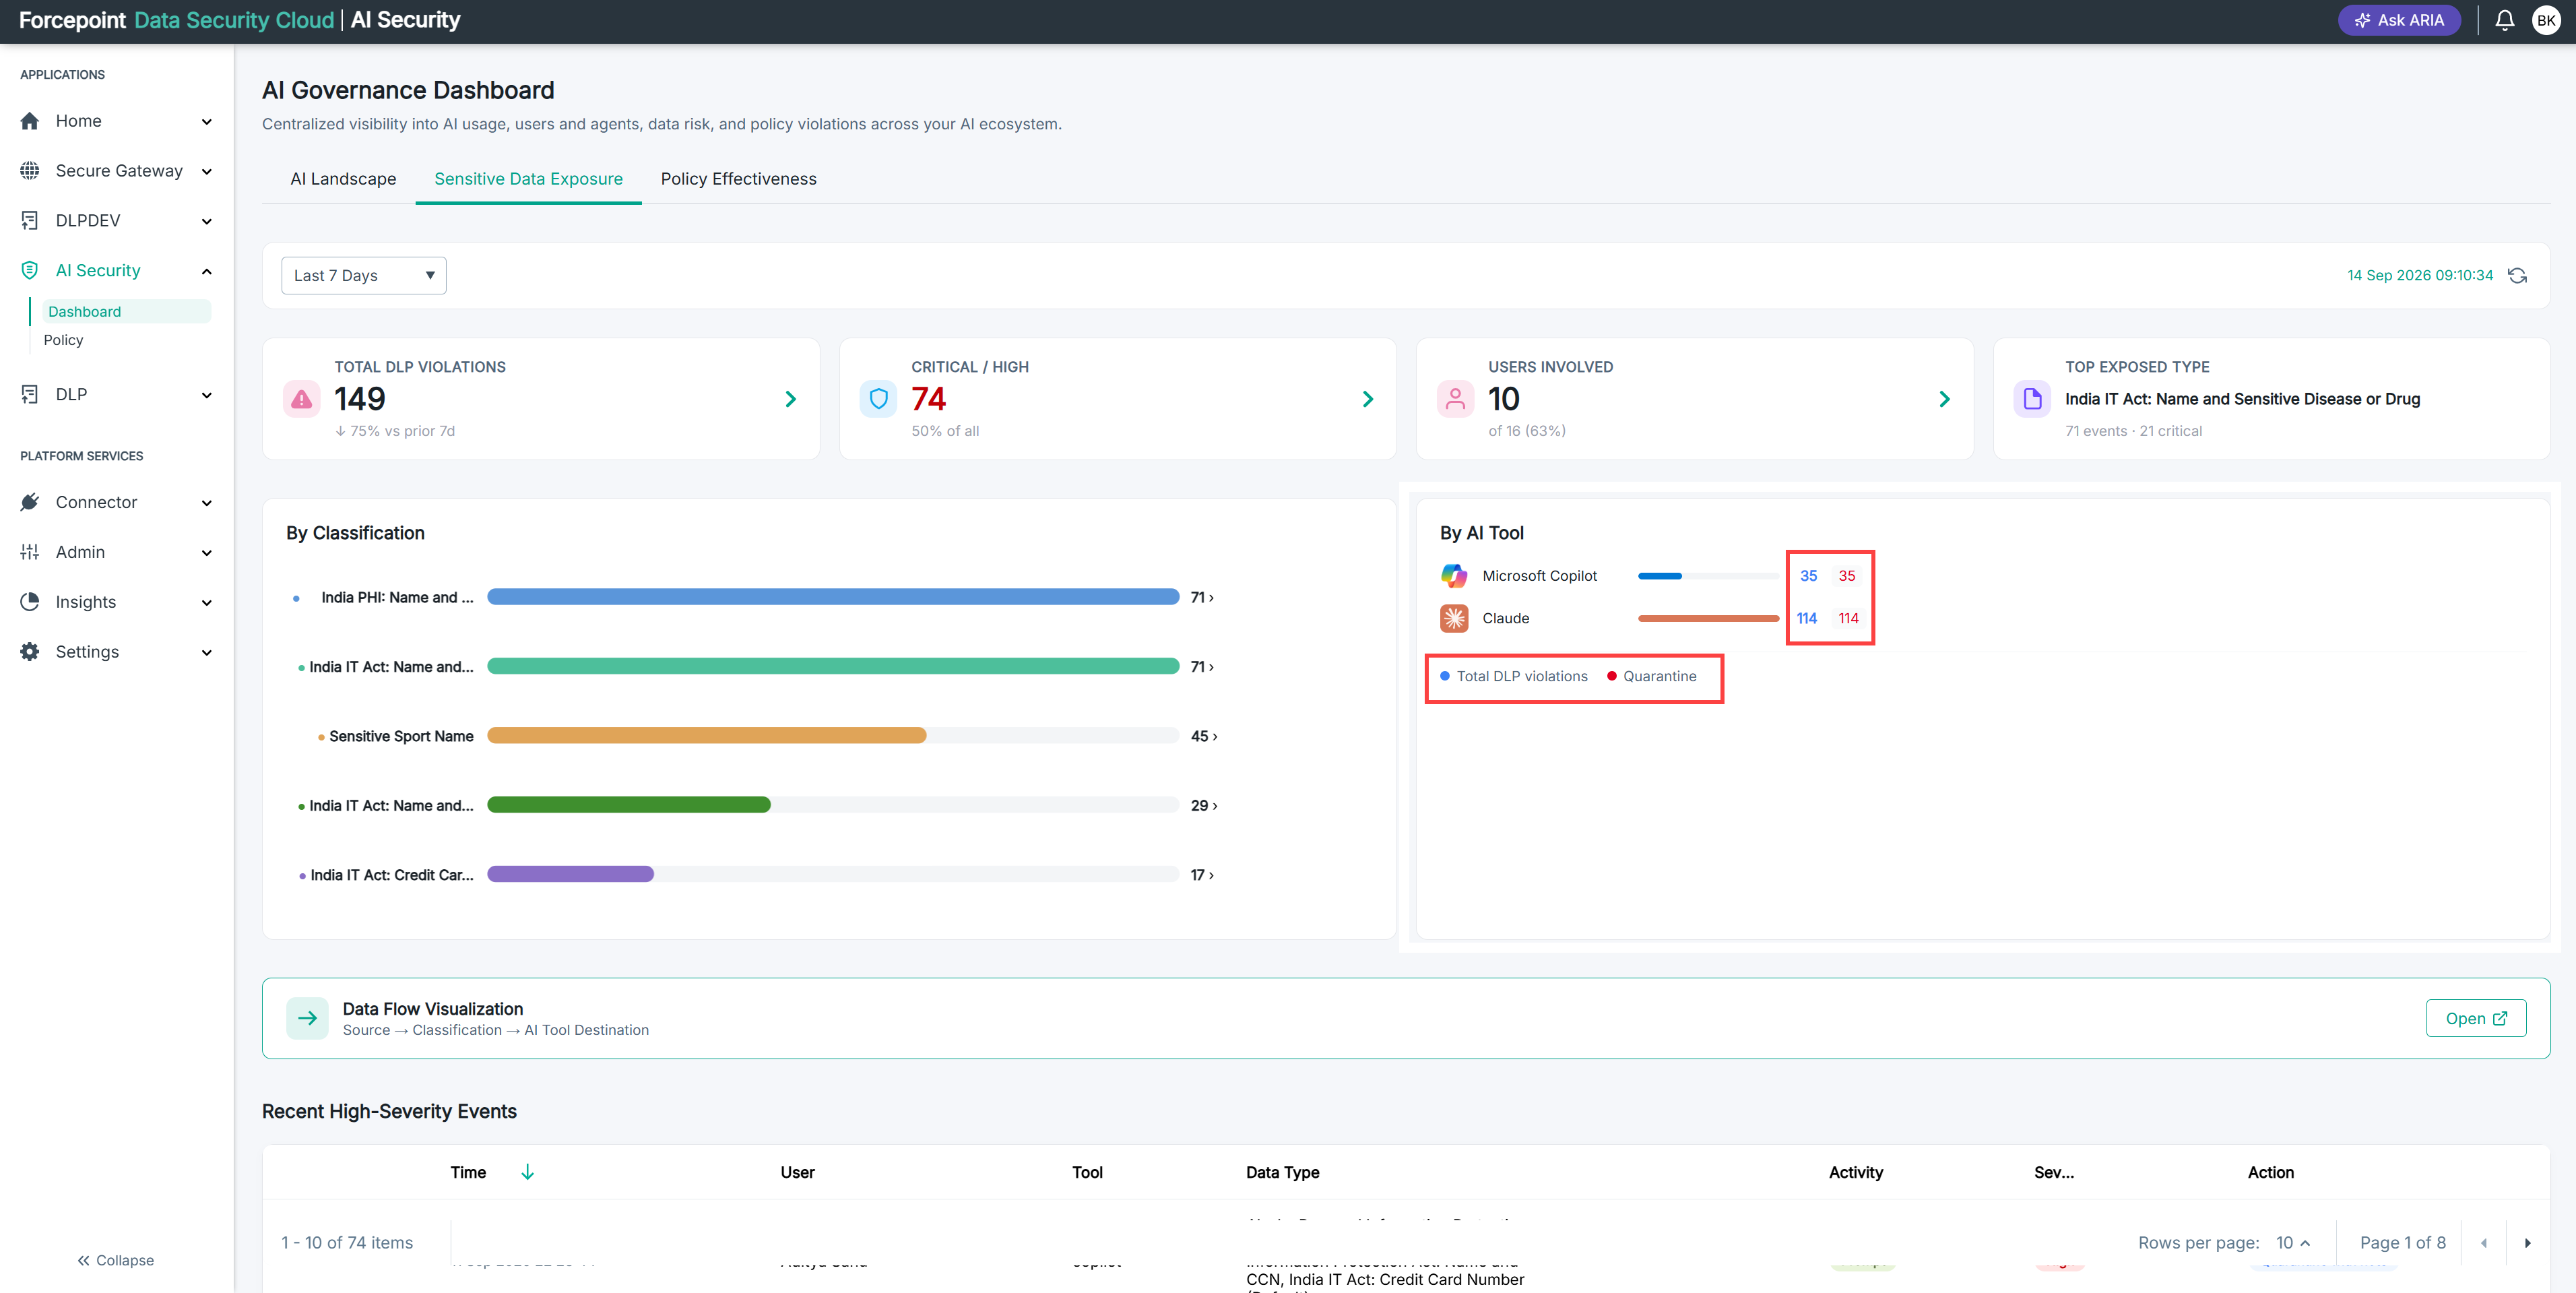
Each AI tool shows two figures, matching the legend below the chart. Total events is every violation recorded for that tool. Quarantine is how many of those were held for review. The gap between them is the sensitive data that passed straight through.
Steps
-
Read the Total events count for the tool.
-
Read the Quarantine count for the same tool.
-
Subtract the quarantine count from the total.
The remainder is the number of violations that were recorded but not held. That sensitive data reached the AI application and stayed there.
-
Repeat for each tool you want to compare.
A tool with a high total and a low quarantine count is where your exposure is concentrated, regardless of how many violations it produced in absolute terms.
Result
You know how much of the sensitive data reaching each AI application was intercepted, rather than only how often your policies are triggering.