Using Health logs
This topic provides use case examples and show you tips for how to properly utilize the Health logs.
The Health logs is a powerful support tool that can help customers pinpoint issues with their setup or within their cloud applications.
Example Use Case
An employee reports a connectivity issue with accessing the cloud app or with email on their mobile device:
- The admin logs in to the Forcepoint Data Security Cloud | SSE portal and checks on the Health dashboard comparing the Server and Forcepoint Data Security Cloud | SSE response codes.
- By viewing the error response codes, they can determine whether the issue is a widespread issue with the backend application or an issue with the Forcepoint Data Security Cloud | SSE service.
- If the issue is determined to be on the backend application, admins will need to investigate that app to discover the cause of the issue.
Display Filter
The display filter is a powerful feature that can allow you to expand, narrow, sort, and separate the pertinent response codes from the common normal codes in order to identify the source of an issue. By default, the display filter shows the previous week and has no filters pre-added so the graph and event logs shows all Server 500, 400 and Bitglass 400 errors generated over the last week.
- You can click into the Start or End fields to bring up the calendar dialogue to expand or shorten the date range displayed.


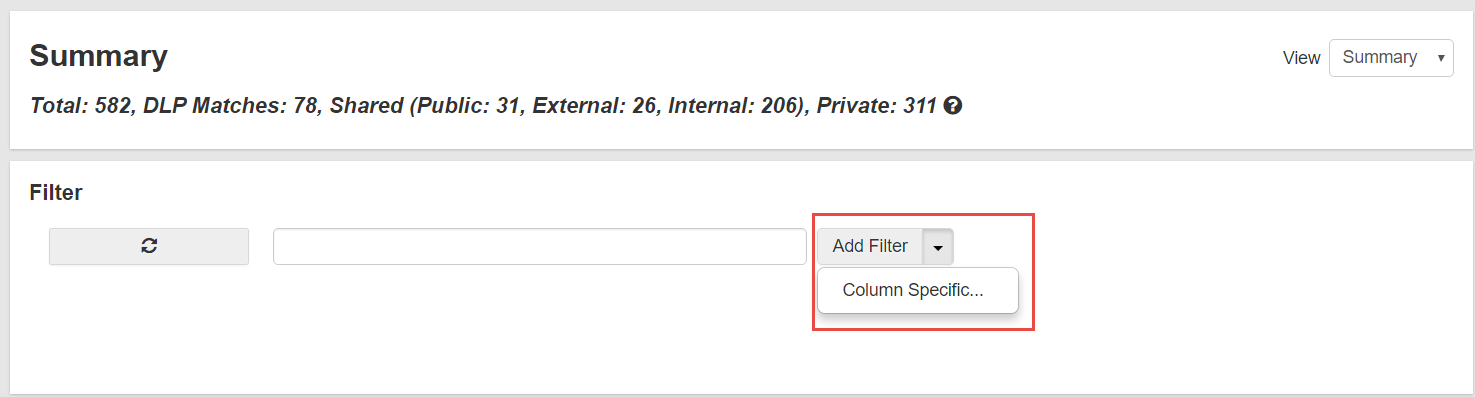
- You can create a filter with any word (or words), you choose across all columns or filter by a specific column:
- Click into the blank field to enter a term to search for across all columns. Note: Entering 2 or more words into the search field will create multiple filters per word. To create a single filter for 2 or more words put the words in quotation marks.
- Click the drop-down to add a Column Specific filter.
- In the column specific filter dialogue, select the Column you wish to filter by in the drop-down and then enter the term or terms you wish to search
by.

Note: Create filters based on the amount of data you are choosing to display (date range). It is recommended that you begin creating filters after narrowing down the date range as opposed to filtering across an entire month or more. Filtering across a large amount of data could lead to slow response times for the page to refresh. - Once you have created filters, you can also negate them to remove all instances of the matched filter. This helps to narrow down the results to the pertinent information and remove all the unnecessary or common codes when attempting to investigate an issue.
- Click into the blank field to enter a term to search for across all columns.
- To remove a term or item from being displayed while filtering, click the plus (+) icon to turn it to a minus (-). See the difference in graph results below.
- Filtering for anything occurring in San Jose.

- Filtering for only response codes 400 occurring in San Jose.
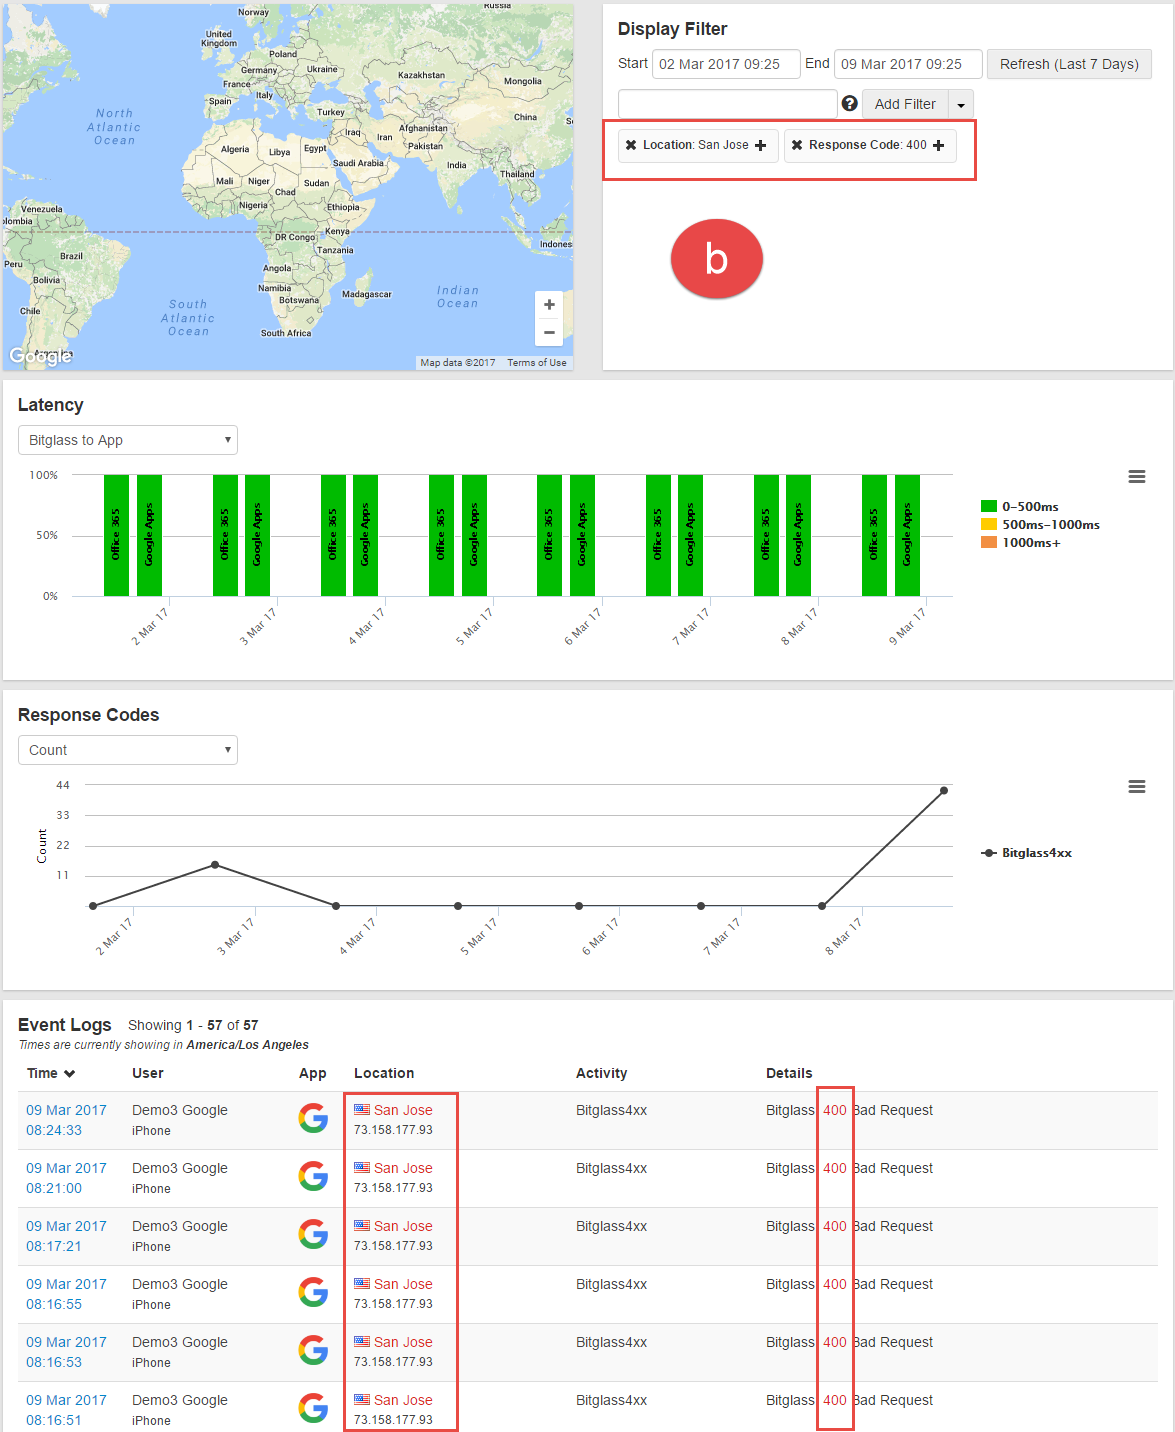
- Filtering for occurrences in San Jose but removing all 400 codes (displaying all other codes). Notice the minus (-) next to the 400 filter to indicate it is being filtered
out of the results.

- Filtering for anything occurring in San Jose.
Utilizing the Graphs
The graph cards display a visual representation of the generated Response Codes over time and will adjust and re-size based on the both the filters created and chosen timeframe.
- The list of Server codes on the side will allow you to display only one set of server codes by clicking on them. Click on that same Server code to display all codes again.
- For example clicking Server 4xx codes will remove all other codes and only display server 4xx response codes. This can be a quick and easy way to filter out
unnecessary information. It will also re-size the graph to better fit the data you are filtering by as well.

- For example clicking Server 4xx codes will remove all other codes and only display server 4xx response codes. This can be a quick and easy way to filter out
unnecessary information. It will also re-size the graph to better fit the data you are filtering by as well.
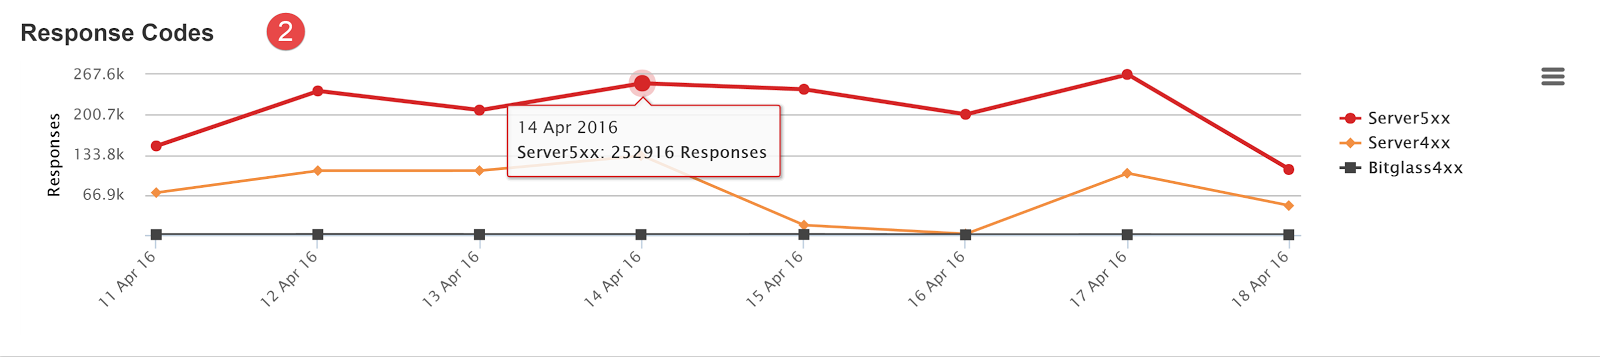
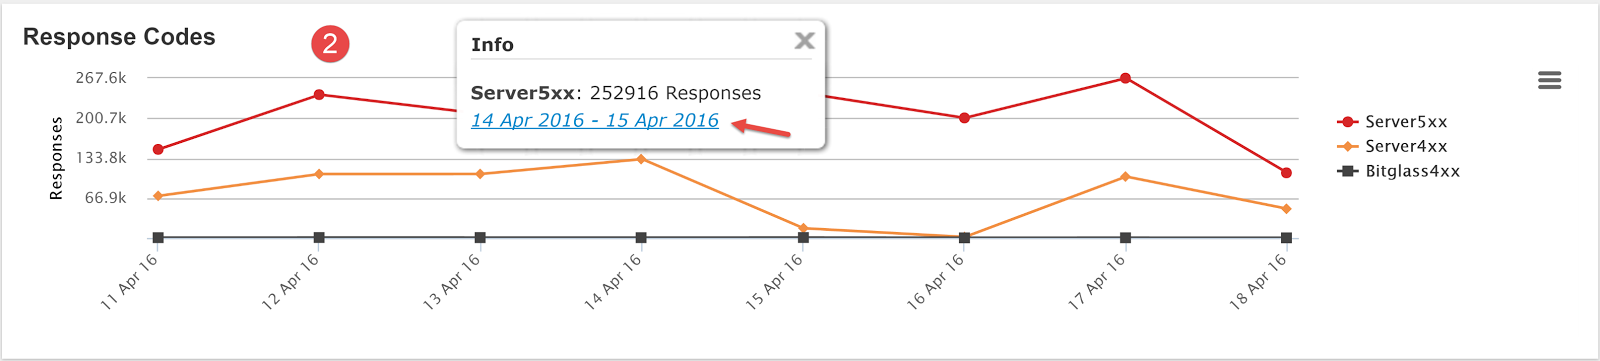
- Clicking into the graph at a certain datapoint will bring up the option to filter by that time frame. Clicking the date range presented will refresh the graph/filters to show that
date range, notice that the graph is resized.

Event Logs
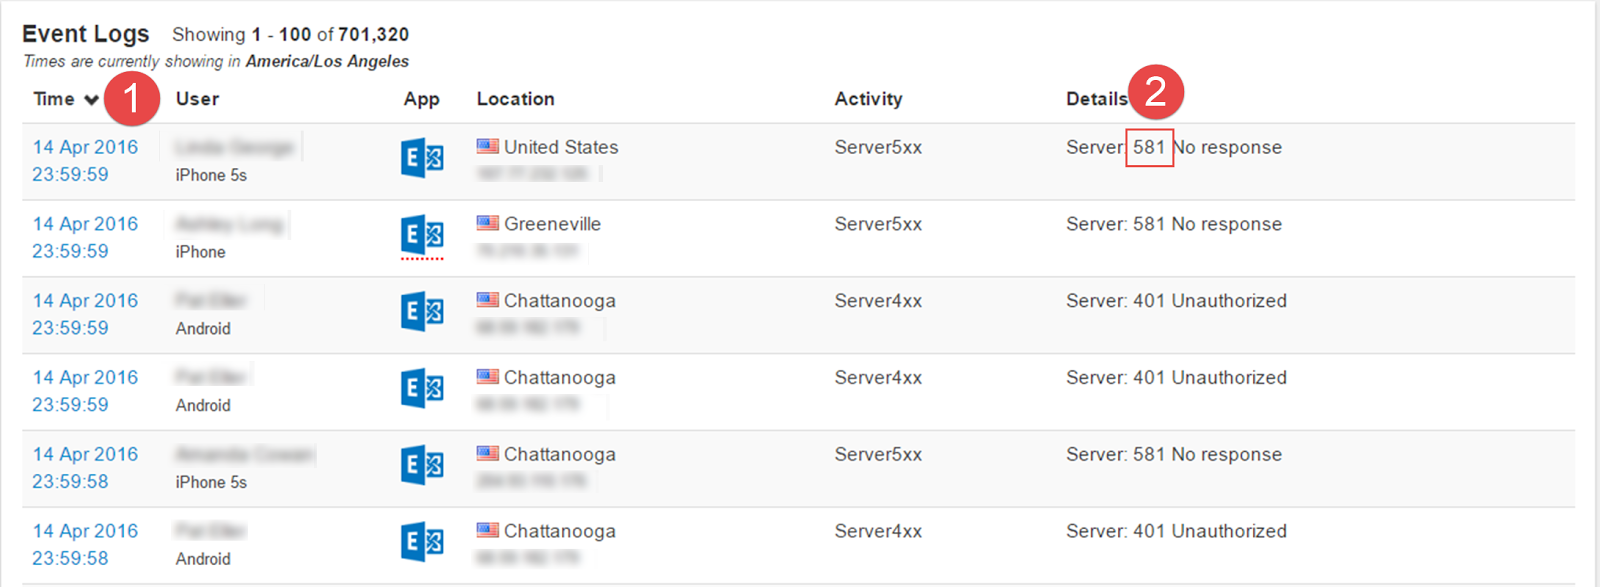
The Event Logs present a detailed view of each response that was generated within the date range that you have selected in the filters. It displays the Time, User, App, Location, Activity, and Details (Response Code) that was generated at that moment.
- You can click into each event to get more detailed information about the generated response.
- Each pertinent piece of information in the event logs is an active link that will create a filter on the item you clicked.
- You can create a filter based on the User Name,
Device Type, App, Region, IP Address, Activity, or Response Code)
- For example clicking on the Response Code in the Detail section will create a filter displaying
only that response code.


- For example clicking on the Response Code in the Detail section will create a filter displaying
only that response code.
- You can create a filter based on the User Name,
Device Type, App, Region, IP Address, Activity, or Response Code)
Tips for how to use the Health Dashboard
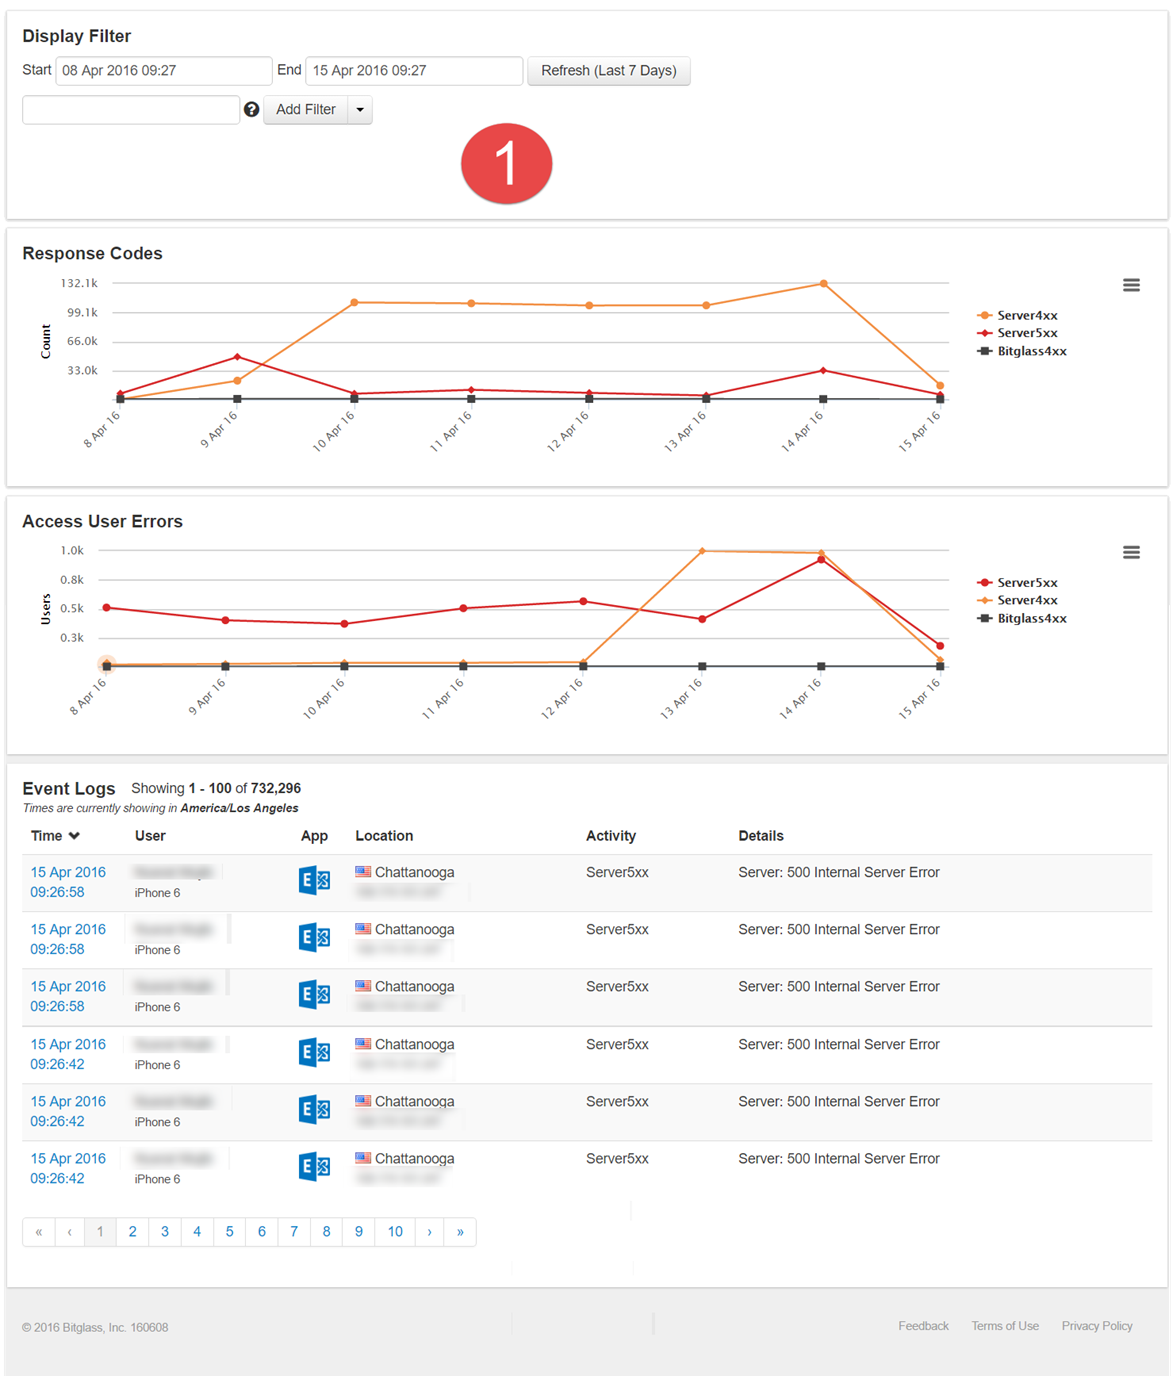
After logging in for the first time, you are presented with a 1 week date range displaying a large number of response codes that have been generated. Below are examples of 3 different Health Dashboards from 3 different companies.
- Graph 1 shows some spikes of Server4xx errors but a relatively steady stream of Server5xx errors.
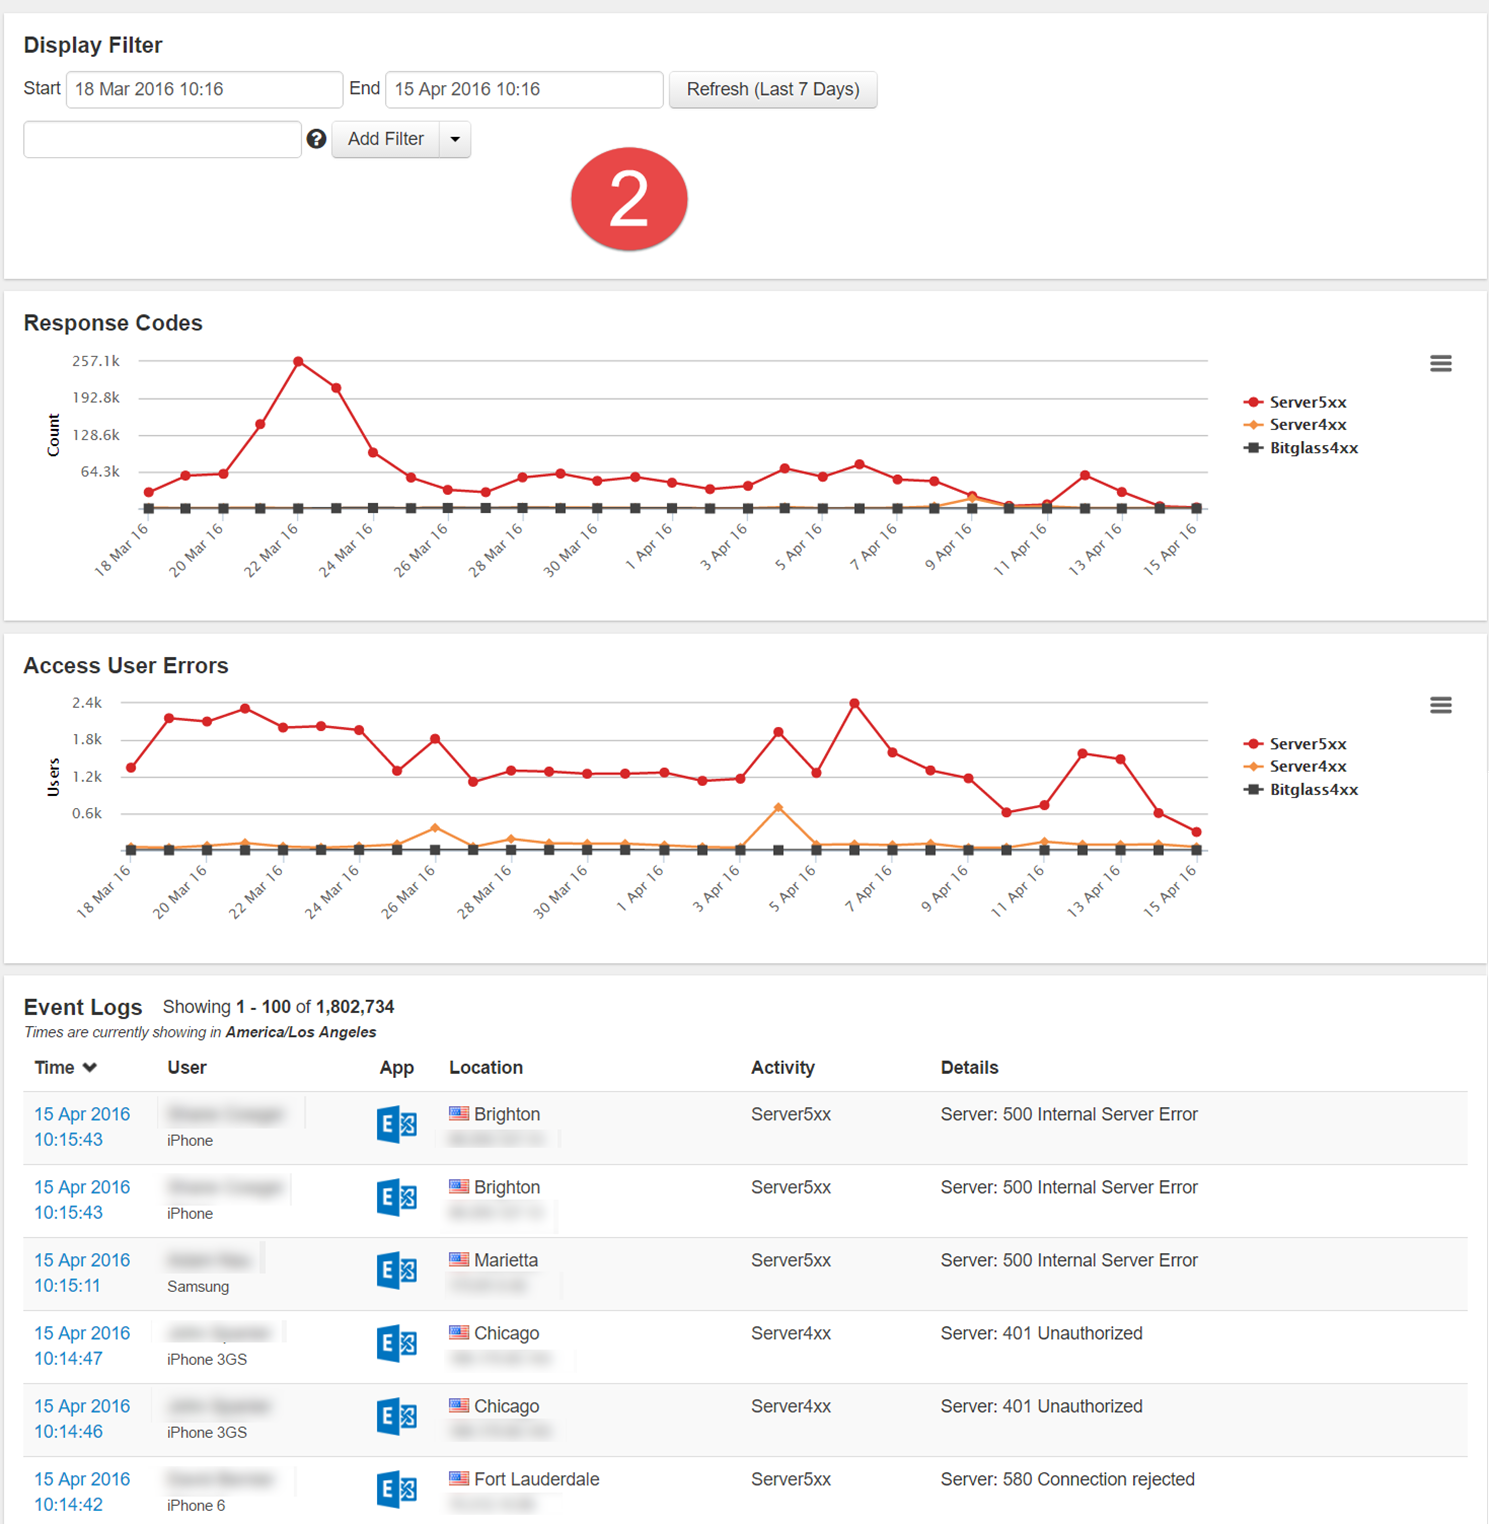
- Graph 2 shows a minimal amount of Server4xx codes and a relatively steady line of Server5xx codes:
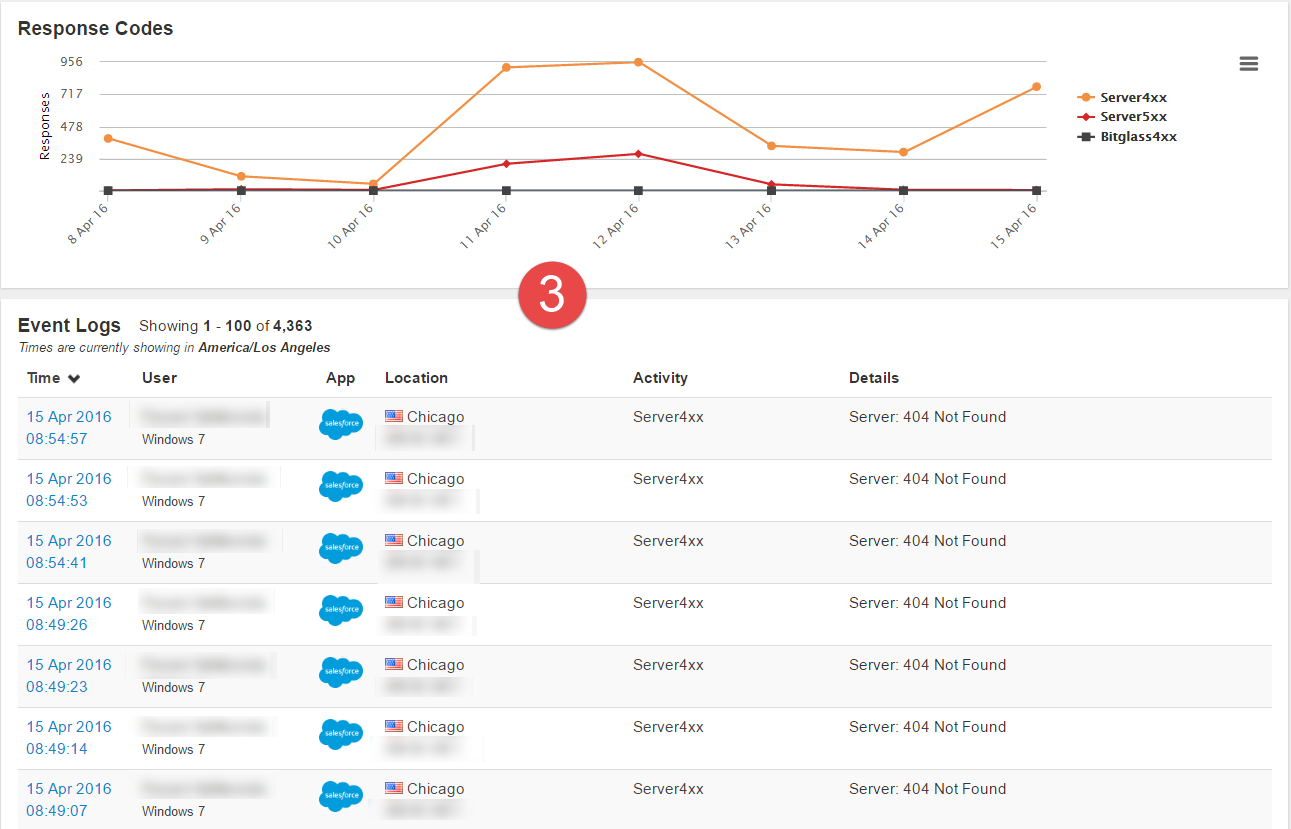
- Graph 3 is quite different from the previous 2. We now see more 4xx errors that spike and drop. The event logs now show a series of 404 responses.

- From these graphs, you can maybe determine that there is an issue going on. You can see some spikes on a few, but you need to gather more information before you can start rooting out the issue or the response codes that are relevant.
- To begin it is best to expand the date range to about a month (maybe more if needed). This will give a larger view of the response codes and allow you to identify greater spikes or
the beginning of an issue (start of response codes being generated). You can also get a greater view to determine the typical response codes that can be removed to help sort and
filter down to the actual codes you need to pay attention to.
- Pulling back graph 1, you get a better view of the response codes. You see that some of the Server5xx codes began in late March. In that same time frame you start to see the appearance of some Server4xx begin for some users. However, you see a sharp spike of those errors around April 9th and then it seems to begin to affect more users by the thirteenth. Using this information, you can confirm with users the start date of their issues and begin to zoom back in on those critical juncture points.
- Pulling back graph 2, you see a slight spike in Server5xx errors but then they plateau out. Pay attention to the spikes of Server4xx errors and dig in to investigate those date ranges.
- If we pull back graph 3, you notice a stark change in the response codes. It’s relatively benign early on with very little 5xx codes overall. However, you see a sharp spike
of 4xx codes around the 6th that remains sporadic.


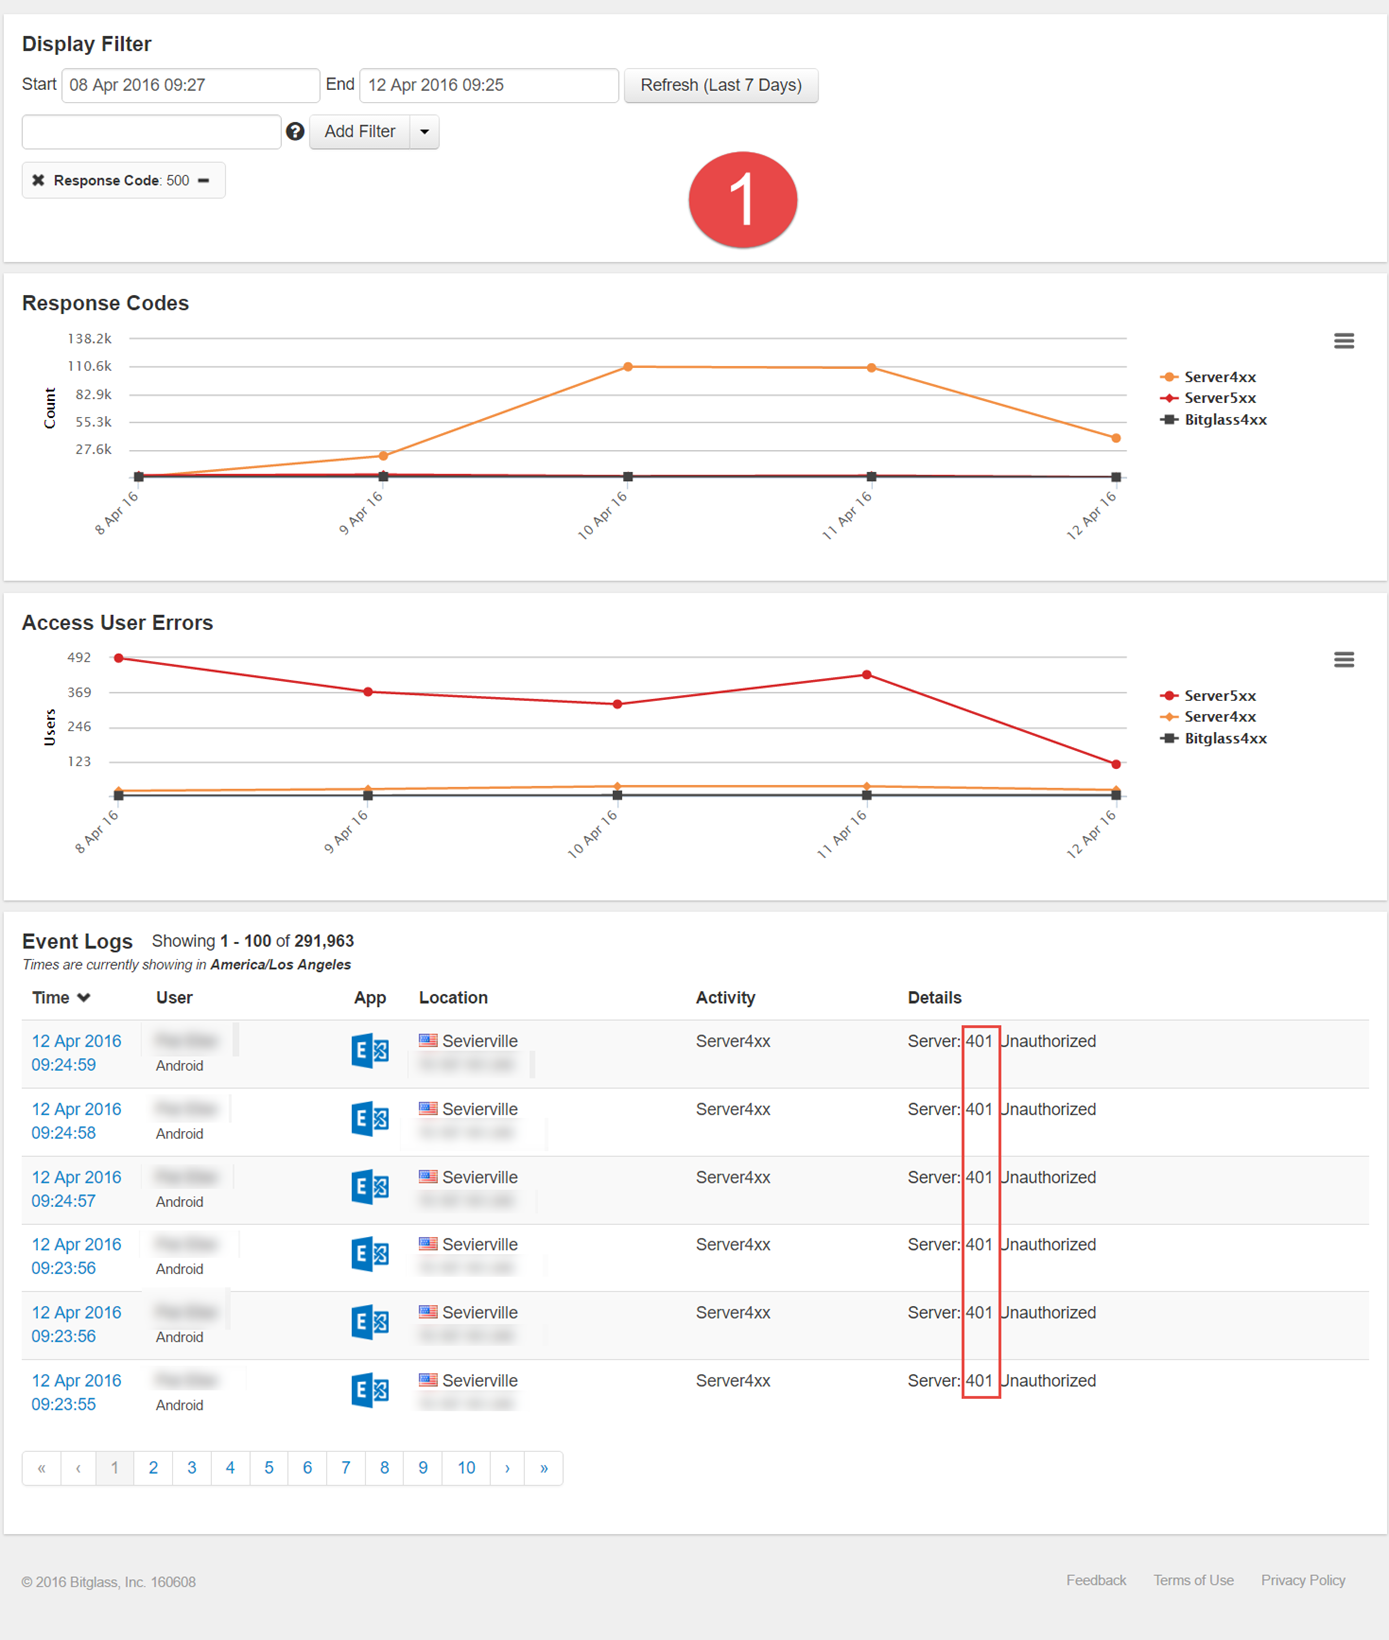
- After zooming in on that initial spike range in graph 1 (April 8th through the 12th) and removing the 500 response codes, you get the below graph. You begin to see a series of 401
unauthorized errors indicating an issue with users being unable to login due to the servers inability to authorize them. Make a note of the 401 error codes and remove from
appearing which brings forward a new error code previously unseen (507). With these error codes in mind, admins can then begin to investigate those date ranges and error codes on
their cloud application. In this particular example, the admin was able to discover a storage space issue that was leading to the authentication issue users were experiencing. They
were able to resolve users connection issues after expanding the memory capacity on their Exchange server.

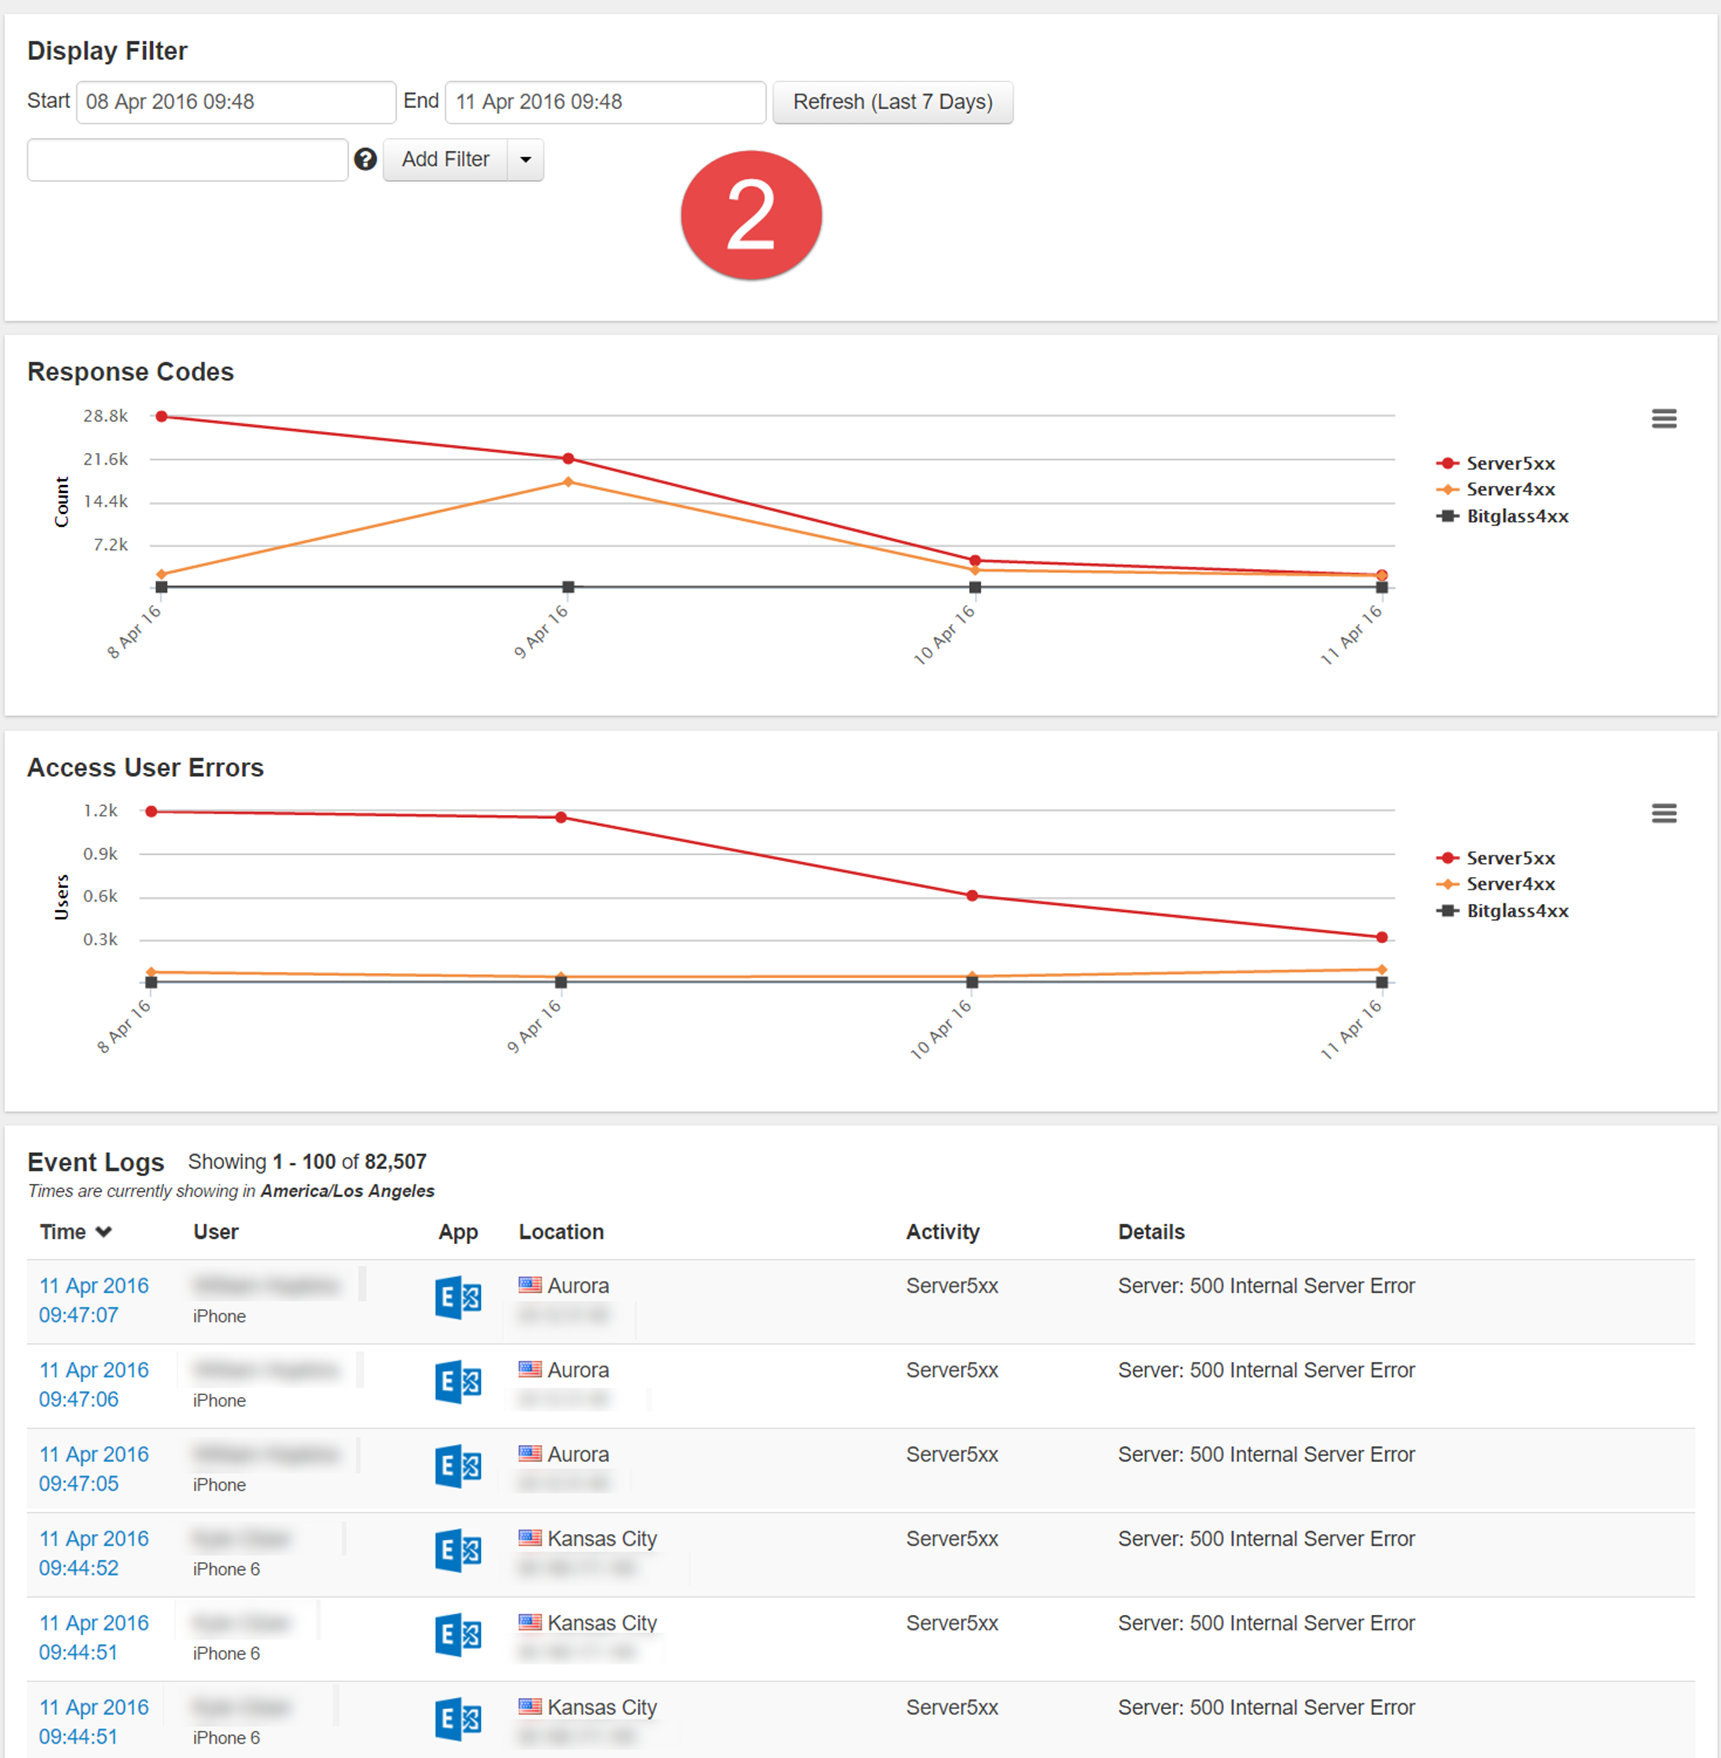
- Zooming in on Graph 2 to the date range of one of the spikes (April 8th to the 11th), you get a graph that displays a steady downward stream of Server5xx and a slight spike of
Server4xx errors. However, scrolling through the event logs all you see are Server500 errors. In order to quickly locate the Server4xx errors, you can create a filter by clicking
the 500 response code then negating the filter so it is removed from the results giving you the next graph below. Admins can then identify some server 580 codes and 401
unauthorized codes again. From there admins will need to work with users and use the information gathered to investigate the cloud application to determine the cause of the issue.

- For graph 3 if you remove the 404 codes, you can see some 5xx code spikes between the 4th through the 9th and then the 11th through the 15th. You can then zoom in on both of those
date ranges and drill down further to discover what is going on. Again, if the codes indicate the source is the backend application this information aids in pinpointing the error
type and date range to assist with investigating the cloud application to resolve the issue.

