The Proxy tab displays response codes and latency time inline.
Graphs
The Proxy tab of the System Health Logs page displays two graphs images that can display 4 different graphs. You can select the drop-down to choose which of the 4 graph options you are viewing.

Response Codes
The Response code graphs displays any response codes generated by the servers separated by code (Server 4xx, Server 5xx, and Forcepoint ONE SSE4xx) to determine the origins and cause of an issue users are experiencing.
- Count: Displays total count of all response codes that have been generated.
- Users: Displays the number of unique users who have received at least one response code

Latency
The Latency graph displays the latency times between the Forcepoint ONE SSE Server and the Cloud application you are connecting to. You can also setup a custom location and use that to track the latency between your browser and the Forcepoint ONE SSE server.
- Forcepoint to App: The Graph displays each app as their own unique column across the timeline. Each App is displayed as a percentage of latency speed groups.
- 0-500ms: Colored Green indicating low latency and a healthy connection
- 500ms-1000ms: Colored Yellow indicating a moderate amount of latency and an above average connection.
- 1000ms+: Colored Orange and indicates an above average amount of latency and a poor connection.
- Clicking on one of the apps in the graph will bring up a popover that will allow you to zoom in on that single application over that date range and also display a breakdown of the request count by latency groups:
- Browser to Forcepoint: Graph displays the location you are tracking from and it's latency to the Forcepoint ONE SSE servers. Latency groups are the same as Forcepoint ONE SSE to App above.

Setup Browser to Forcepoint Tracking
In order to track the latency between your browsers to the Forcepoint ONE SSE server, you will need to first create a custom location and then setup that location inside the latency graph.
- The first thing you will need to do is navigate to and add a custom location for your current IP address (or IP range).
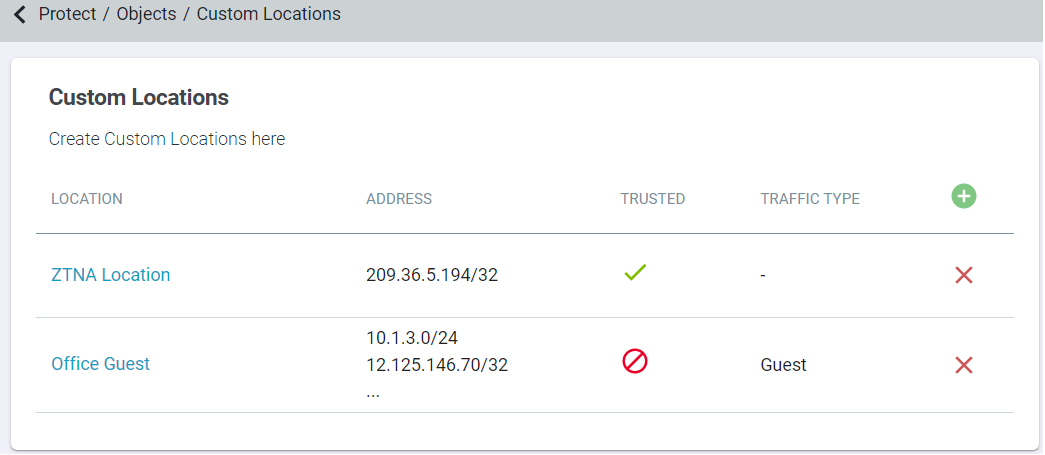
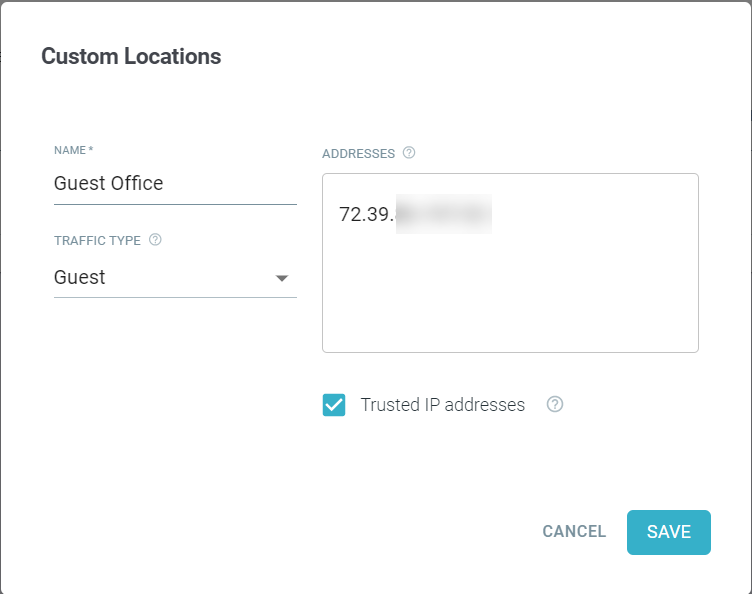
- Navigate to the System Health Logs page, select the drop-down on the Latency Graph and choose Browser to Forcepoint. Now,
select Setup Browser to Forcepoint Tracking and you will be redirected to the page. Once there click the green plus icon and select your previously setup custom location in the first step.

Event Logs
Below the graph you can see a more detailed view of the event logs being generated. You can select an event log for more information:


HTTP Response Codes
- Server 4xx: Aggregate of all backend app 4xx messages returned by the server (example: 401 or 402 error messages).
- Server 5xx: Aggregate of all backend app 5xx messages returned by the server (example: 503 error messages)
- Bitglass 4xx: Aggregate of all Bitglass 4xx messages generated by Forcepoint ONE SSE as opposed to forwarded on behalf of Forcepoint ONE SSE. (example: a 401 error because of a user account/profile lookup failure).
Common Response Codes
| Response Code | Description | Notes |
|---|---|---|
| 581 | No Response from the server | A Forcepoint ONE SSE created code to denote that Forcepoint ONE SSE did not receive a response from the server. Will also indicate when an upload fails. |
| 580 | Reset Connection | A Forcepoint ONE SSE created code to denote that the upstream server killed the connection |
| 507 | Insufficient Storage | The server is unable to store the representation needed to complete the request |
| 500 | Internal Server Error | Generic message given when an unexpected condition was encountered. Also given when an upload fails. |
| 449 | Retry With | The Server cannot honor the request because the user has not provided the required information |
| 404 | Not Found | The requested resource could not be found. |
| 403 | Forbidden | Request was valid, but the server is refusing to respond. Typically means unauthorized permission. |
| 401 | Unauthorized | Similar to 403, but specifically when authentication is required and has failed or has not been provided. |
| 400 | Bad Request | Server cannot or will not process the request due to an apparent client error. Typically incorrect syntax in the request, etc. |
- For more information on HTTP response codes, click here to view the wiki page.
- To learn how to use the System Health Logs, refer to Using Health logs.