The Web logs is where all the web browsing events generated from users using the SmartEdge agent and Cloud SWG while accessing websites are logged. Reports are generated every 5 minutes with new log data. Log data is kept for 30 days.
You can access it by navigating to . The Web logs page displays 50 entries per page and 10000 entries in total. By default, filter is set to Action = Denied for Web Logs which can be modified as per your requirement.
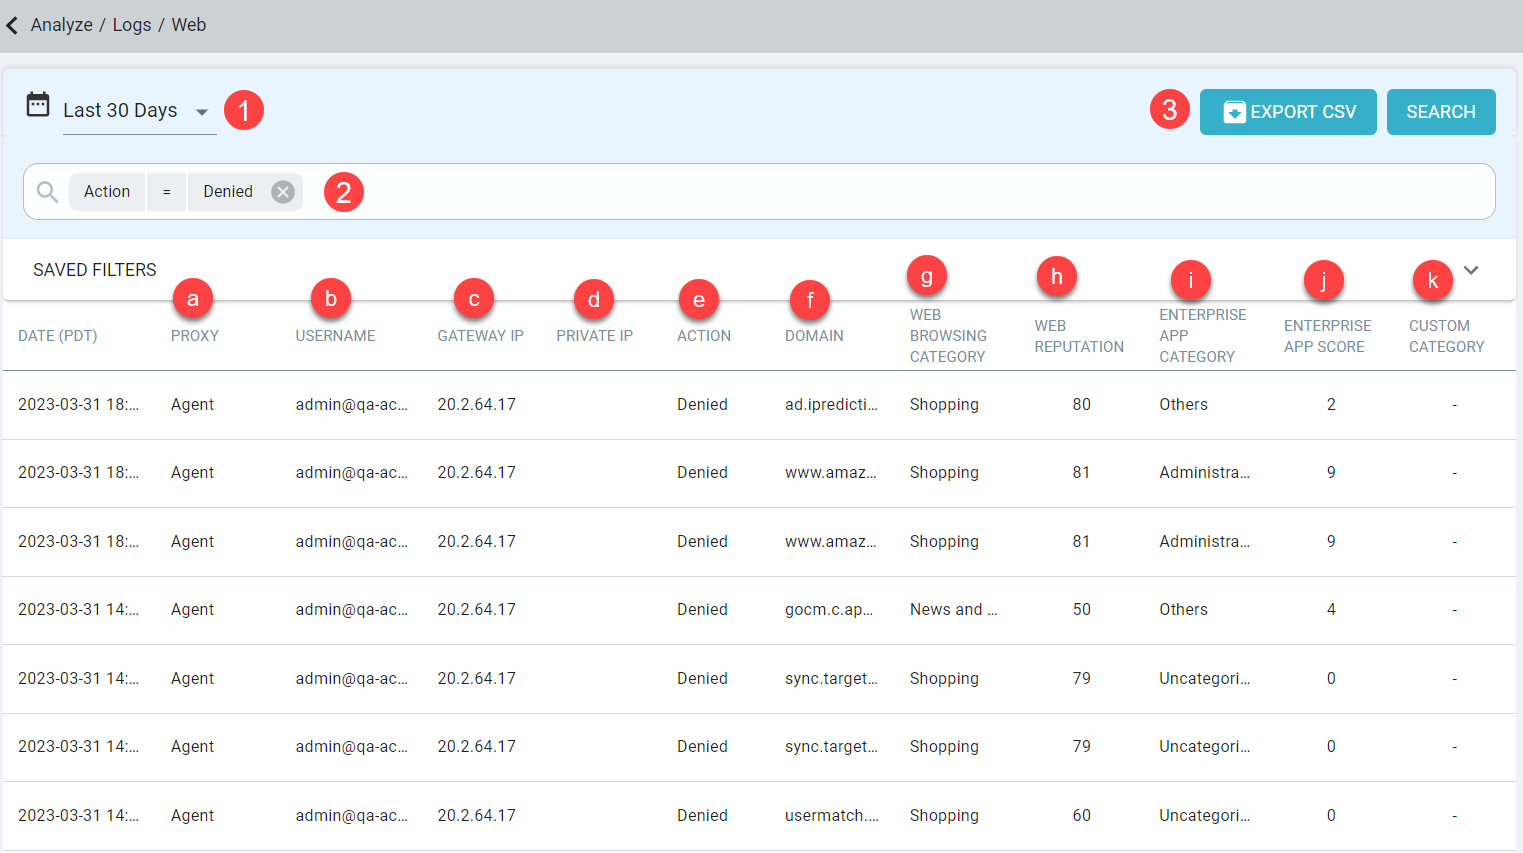
- Time filter: Allows you to filter the logs for selected period.
- Last 24 Hours (default)
- Last 7 Days
- Last 30 Days
- Custom
When you select Custom, you should select Start Time and End Time and click Apply to view logs for selected period. You can view logs for a maximum period of 30 days from today.

- Search: Will allow you to configure and filter the logs by any of the columns displayed. By default, filter is set to Action = Denied. See below for information
on each of these columns.
- Proxy: Displays the proxy that generated the log.
- Can be filtered by equals or not equals and then select Agent or Cloud SWG option.
- Username: Displays the user's Forcepoint ONE SSE username.
- Can be filtered by equals, not equals, contains or does not contain and then entering characters or the username.
- Gateway IP: Displays the public IP address of the site that the user was using for the event.
- Can be filtered by equals, not equals, contains or does not contain and then entering the IP or numbers.
- Private IP: Displays the private IP address of the datacenter that the user was using for the event.
- Can be filtered by equals, not equals, contains or does not contain and then entering the IP or numbers.
- Action: Displays the action taken by Forcepoint ONE SSE.
- Can be filtered by equals or not equals and then select the one of the option (Alert, Allowed, Denied, Notify, Process via Cloud and Isolated)
- Domain: Displays the website's domain URL that was being accessed.
- Can be filtered by equals, not equals, contains, does not contain, start with or ends with and then entering characters
- Web Browsing Category or URL Category:
- The Web Browsing Category column is available when the ThreatSeeker URL Categories feature is disabled. The Web Browsing Category column displays the category the site falls into from Webroot.
- The URL Category column is available when the ThreatSeeker URL Categories feature is enabled. The URL Category column displays the category the site falls into from ThreatSeeker URL Categories.
Can be filtered by has or does not have and then selecting the category from the list.
- Web Reputation or URL Reputation:
- The Web Reputation column is available when the ThreatSeeker URL Categories feature is disabled. The Web Reputation column displays the sites Web Reputation
score on a scale of 0-100 from Webroot.
- Can equal or not equal different reputation ranges—Trustworthy (81-100), Low Risk (61-80), Moderate Risk (41-60), Suspicious Risk (21-40), High Risk (1-20).
- The URL Reputation column is available when the ThreatSeeker URL Categories feature is enabled. The URL Category column displays the sites URL Reputation score
on a scale of 0-100 from ThreatSeeker URL Reputation.
- Can equal or not equal different reputation ranges—Very Safe (90-100), Fairly Safe (80-89), Marginally Safe (70-79), Suspicious (60-69), Harmful (0-59)
- The Web Reputation column is available when the ThreatSeeker URL Categories feature is disabled. The Web Reputation column displays the sites Web Reputation
score on a scale of 0-100 from Webroot.
- Enterprise App Category: Displays the category the site falls into from Forcepoint ONE SSE's category list.
- Can be filtered by has or does not have and then selecting the category from the list.
- Enterprise App Score: Displays the sites app score on a scale of 0-10 based on Forcepoint ONE SSE's scoring.
- Can equal or not equal different reputation ranges - Trustworthy (9-10), Low Risk (7-8), Moderate Risk (4-6), Suspicious Risk (2-3), High Risk (0-1).
- Custom Category: Displays the custom category object that admins may have configured on the page for controlling or allowing specific groups of sites.
- Can be filtered by has or does not have and then selecting the category from the list.
You can create and save filters as needed. For example, creating a filter where proxy equals agent and web reputation equals trustworthy.
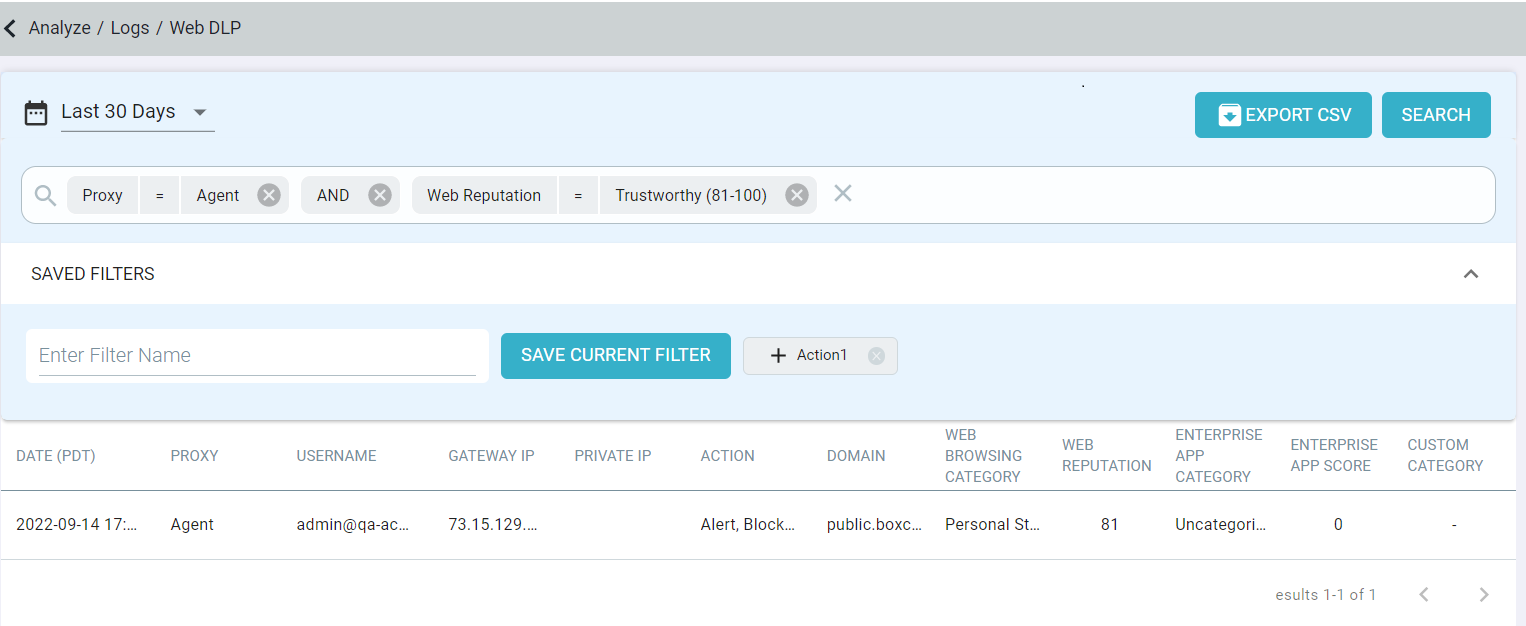
- Proxy: Displays the proxy that generated the log.
- Export CSV: After applying required filters, you can click Export CSV to export filtered logs in a zipped csv file. The CSV file contains latest 25000 records with all the fields.
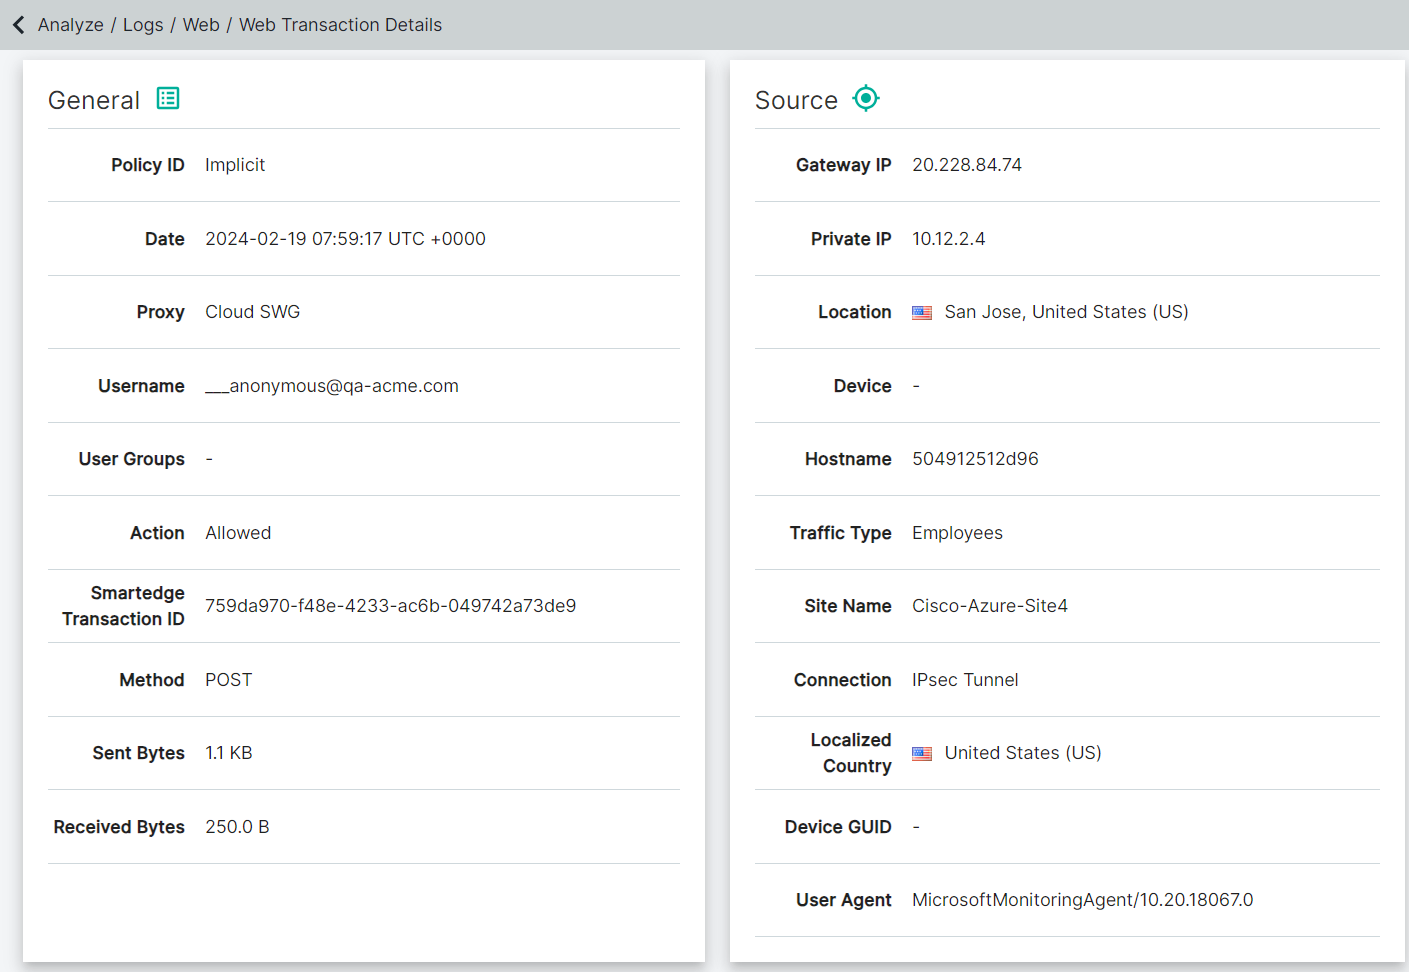
- Clicking into an event log line will take you to a details page providing further information about the event including information such as the HTTPs request transaction being made (method
type), bytes being sent/received, further information about the user's device (hostname), as well as more detailed information drawn from our cloud app repository of the app or site being
accessed.The following is an example of Web Transaction Details when the ThreatSeeker URL Categories feature is disabled:

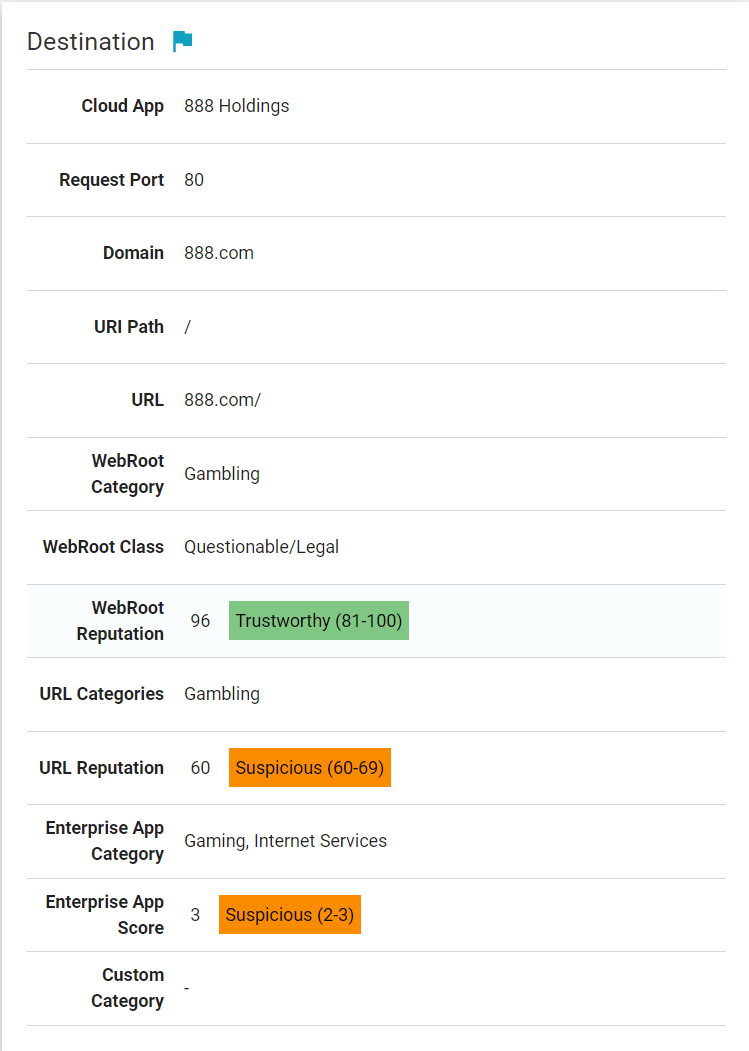
The following is an example of Web Transaction Details when the ThreatSeeker URL Categories feature is enabled:
Consider the following while reviewing logs:
- For files uploaded with a size greater than 40MB regardless of the SWG Content Policy setup, the traffic will be sent directly to internet and the Policy ID field will be set to 0000000.
-
The Connection field under the Source section displays connection type on which the transaction was received over:
- For Cloud SWG Explicit Proxy traffic - Explicit Proxy
- For Cloud SWG Transparent Proxy traffic - IPsec or GRE
- The Localized Country field displays the localization country to which your web content is localized.