Forcepoint provides a Splunk app on Splunkbase for easily integrating with Forcepoint Data Security Cloud | SSE's AWS S3 data lake for pulling Forcepoint Data Security Cloud | SSE SWG Web raw logs for Allowed, Denied, Process via Cloud and Isolated actions.
Follow the steps below to pull logs to your Splunk Instances:
Steps
-
On Forcepoint Data Security Cloud | SSE, create an Access Point.
-
On a new browser tab or window, login to your Splunk instance.
-
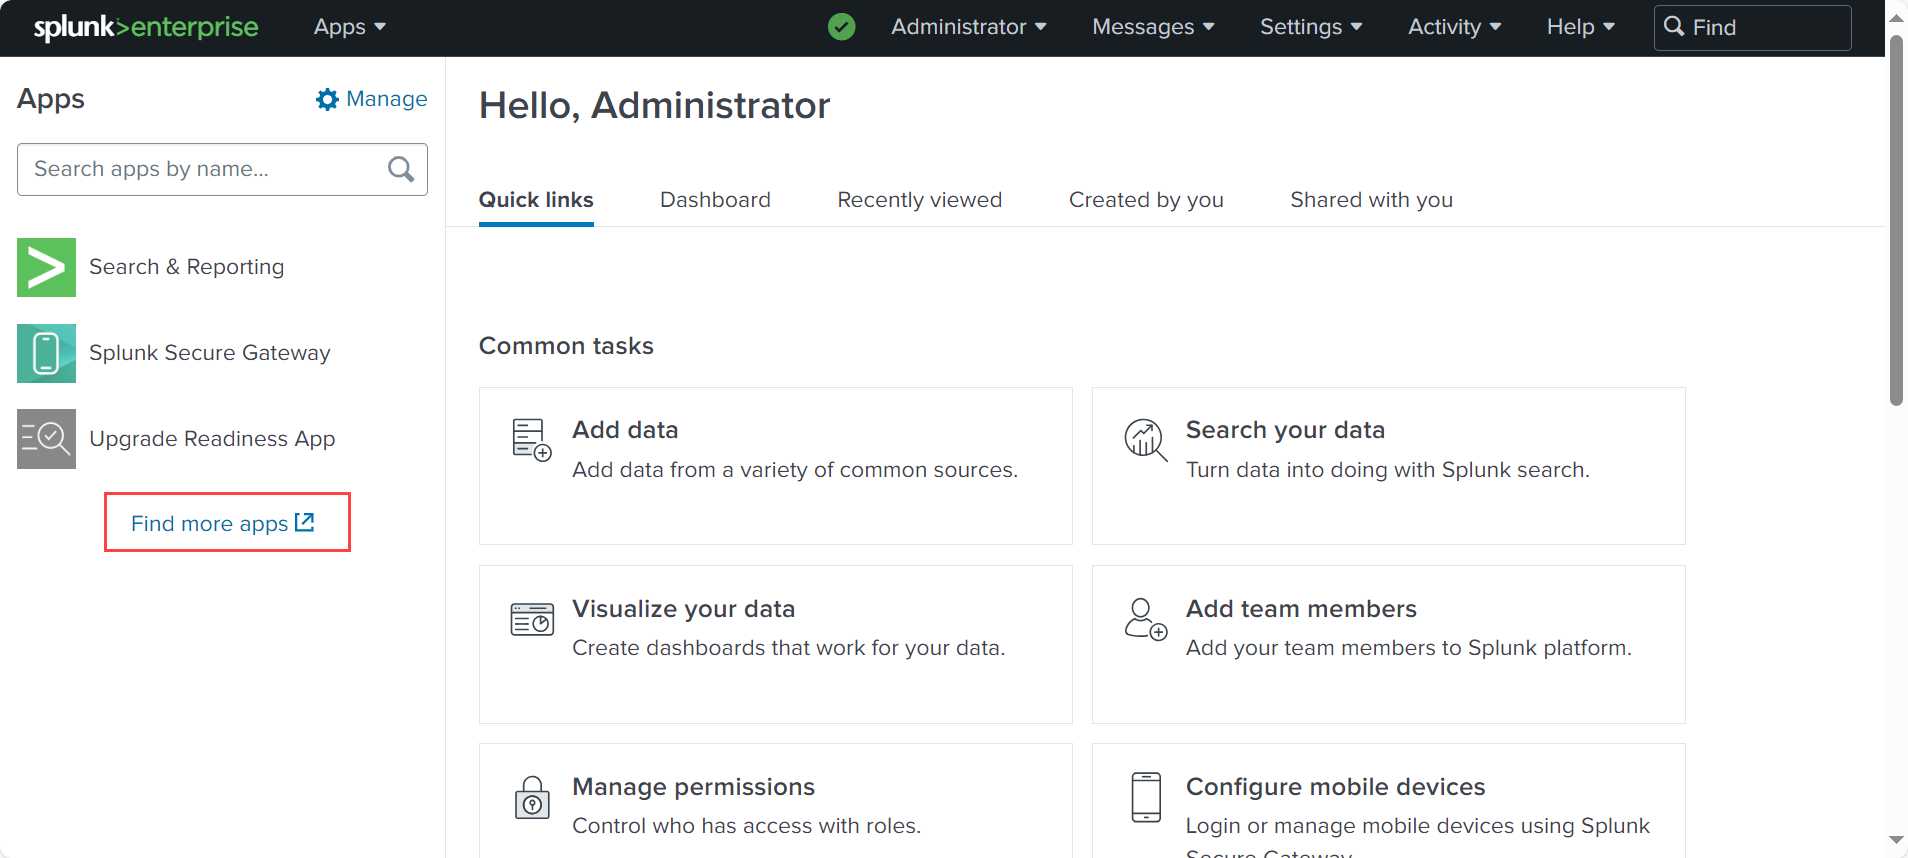
On the Splunk homepage, click Find More Apps from the left column and search for Forcepoint ONE App for Splunk.
-
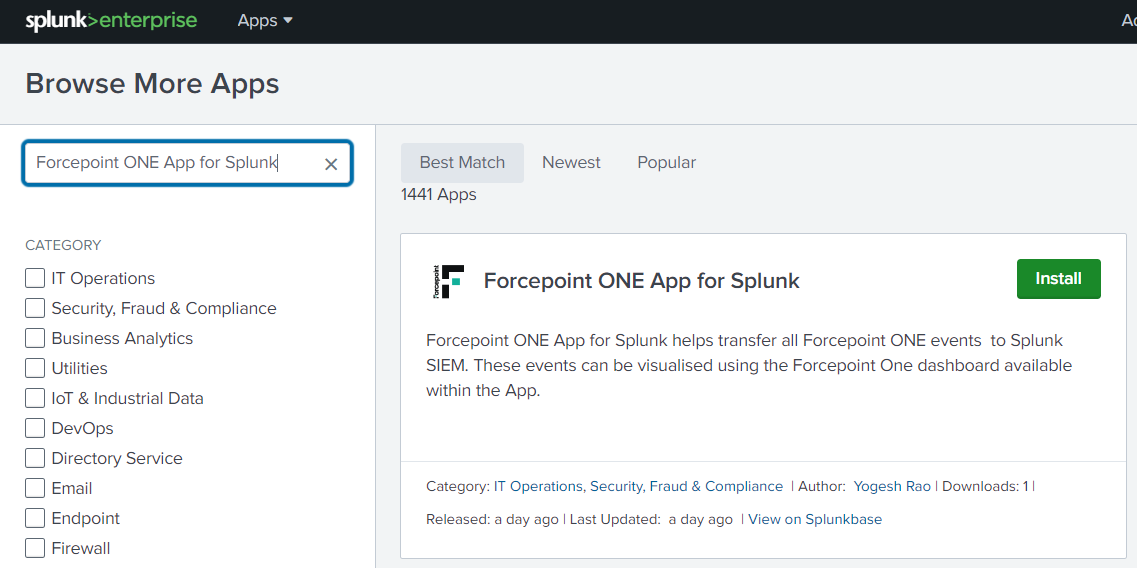
From the search results, click Install on the Forcepoint ONE App for Splunk tile.
-
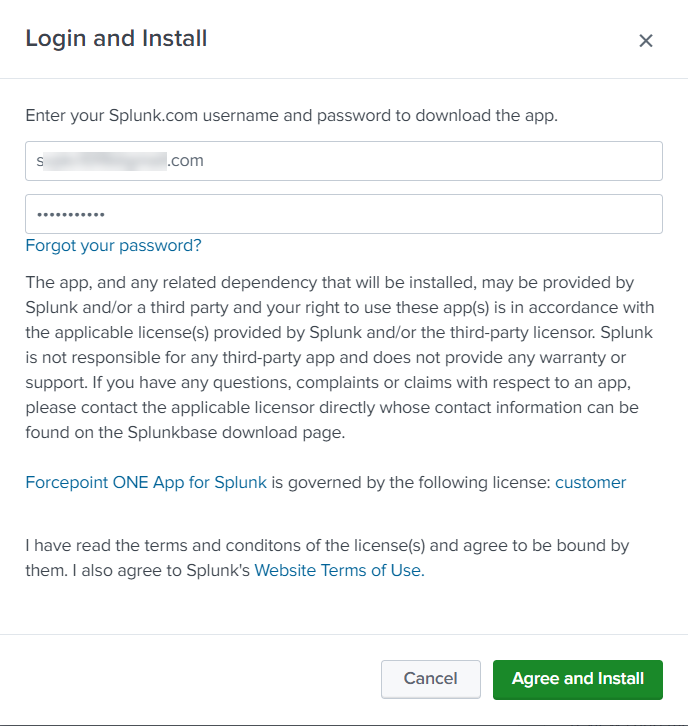
On the Login and Install dialog:
-
Enter your Splunk.com account login credentials.
-
Click Agree to Install.
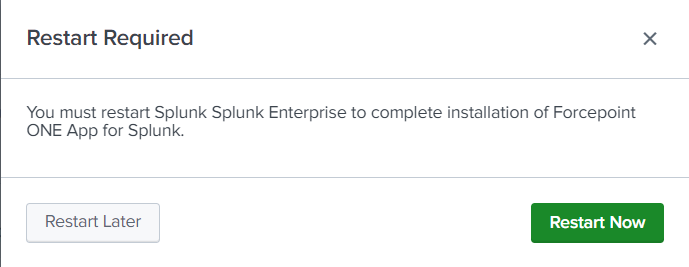
It will require you to restart your Splunk instance.
-
Click Restart Now to restart the Splunk instance.
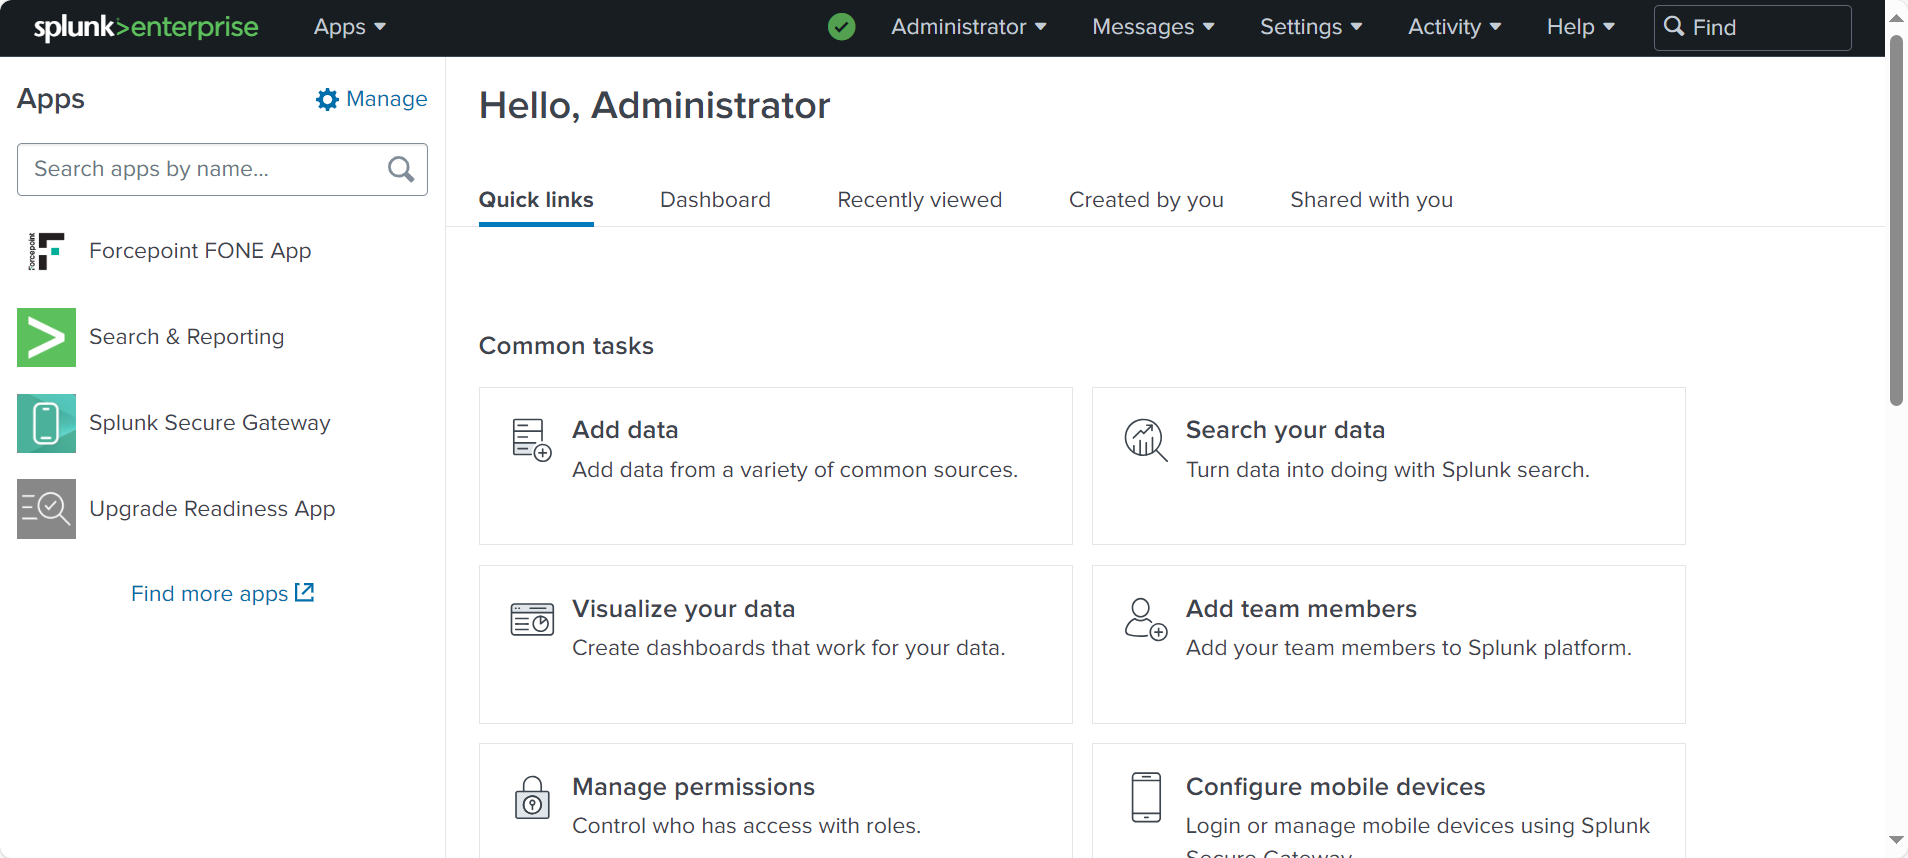
After successfully restarting the Splunk instance, you will now see the Forcepoint FONE App on the left column.
-
Select Forcepoint FONE App on the left column and then click Continue to app setup page on the next window that pops up to configure the
settings.
-
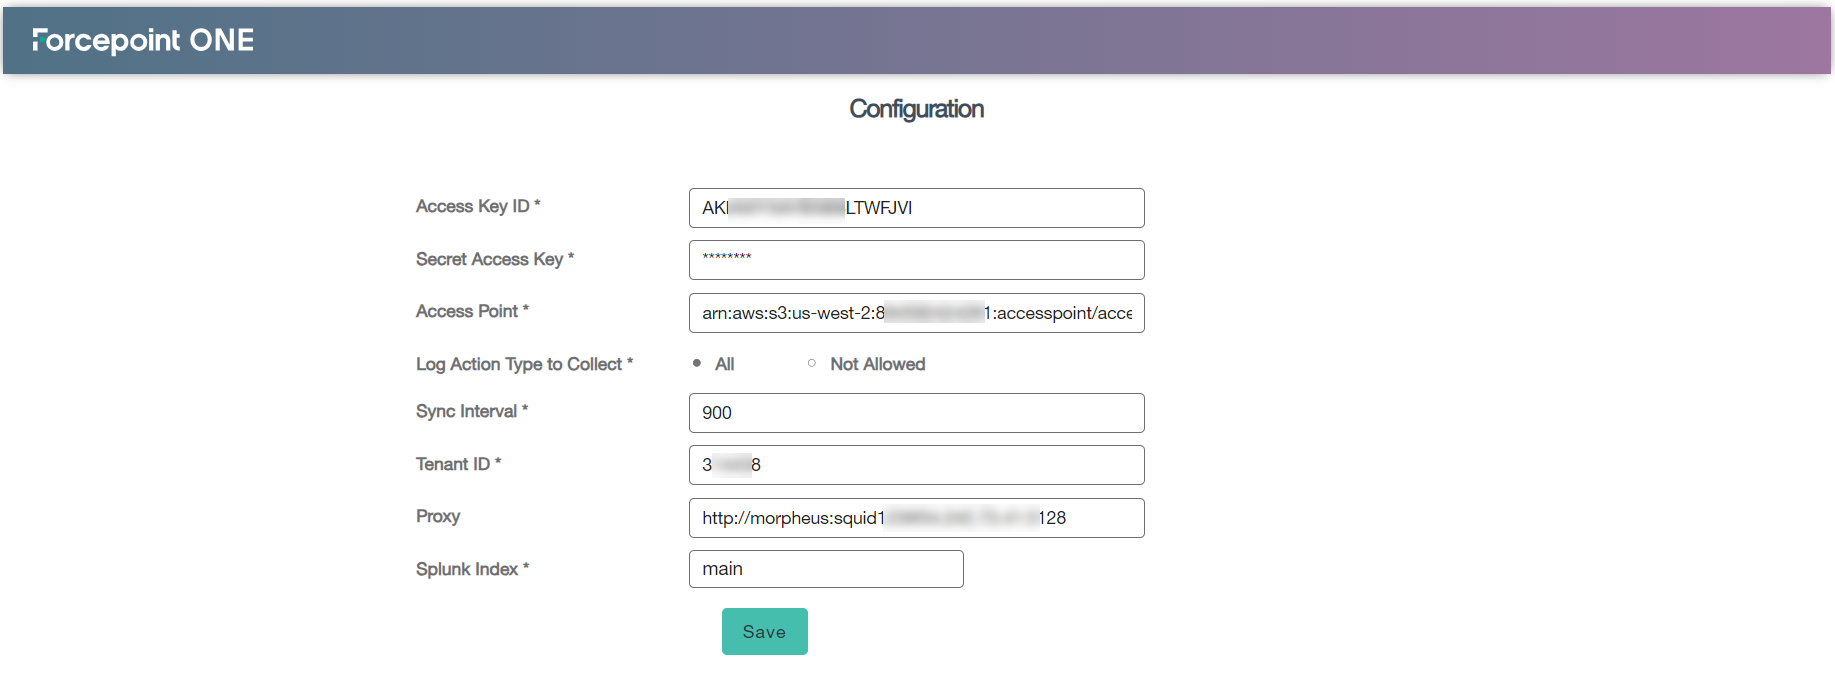
On the Forcepoint ONE Configuration page:
-
Enter the IAM user's Access Key ID and Secret Access Key of customer's AWS account for which Access Point was created.
-
Copy the Access Point ARN value from the Forcepoint Data Security Cloud | SSE (step 1) and paste in the Access Point
field.
-
Select one of the following options to pull and to display SWG logs in the Web Analysis dashboard:
-
Enter Sync Interval in seconds to define how often the logs should be pulled.
You can only set the values in the range of 600 to 3600 seconds. If you set to lower value, then the sync latency is less when compared to the higher value.
-
Enter the Forcepoint Data Security Cloud | SSE
Tenant ID.
-
Leave the Proxy (optional) field as is unless you are routing your API calls through a proxy at which point you will need to fill out this field.
-
From the Splunk Index drop-down, select the index in which data to be stored.
-
To save the changes, click Save.
-
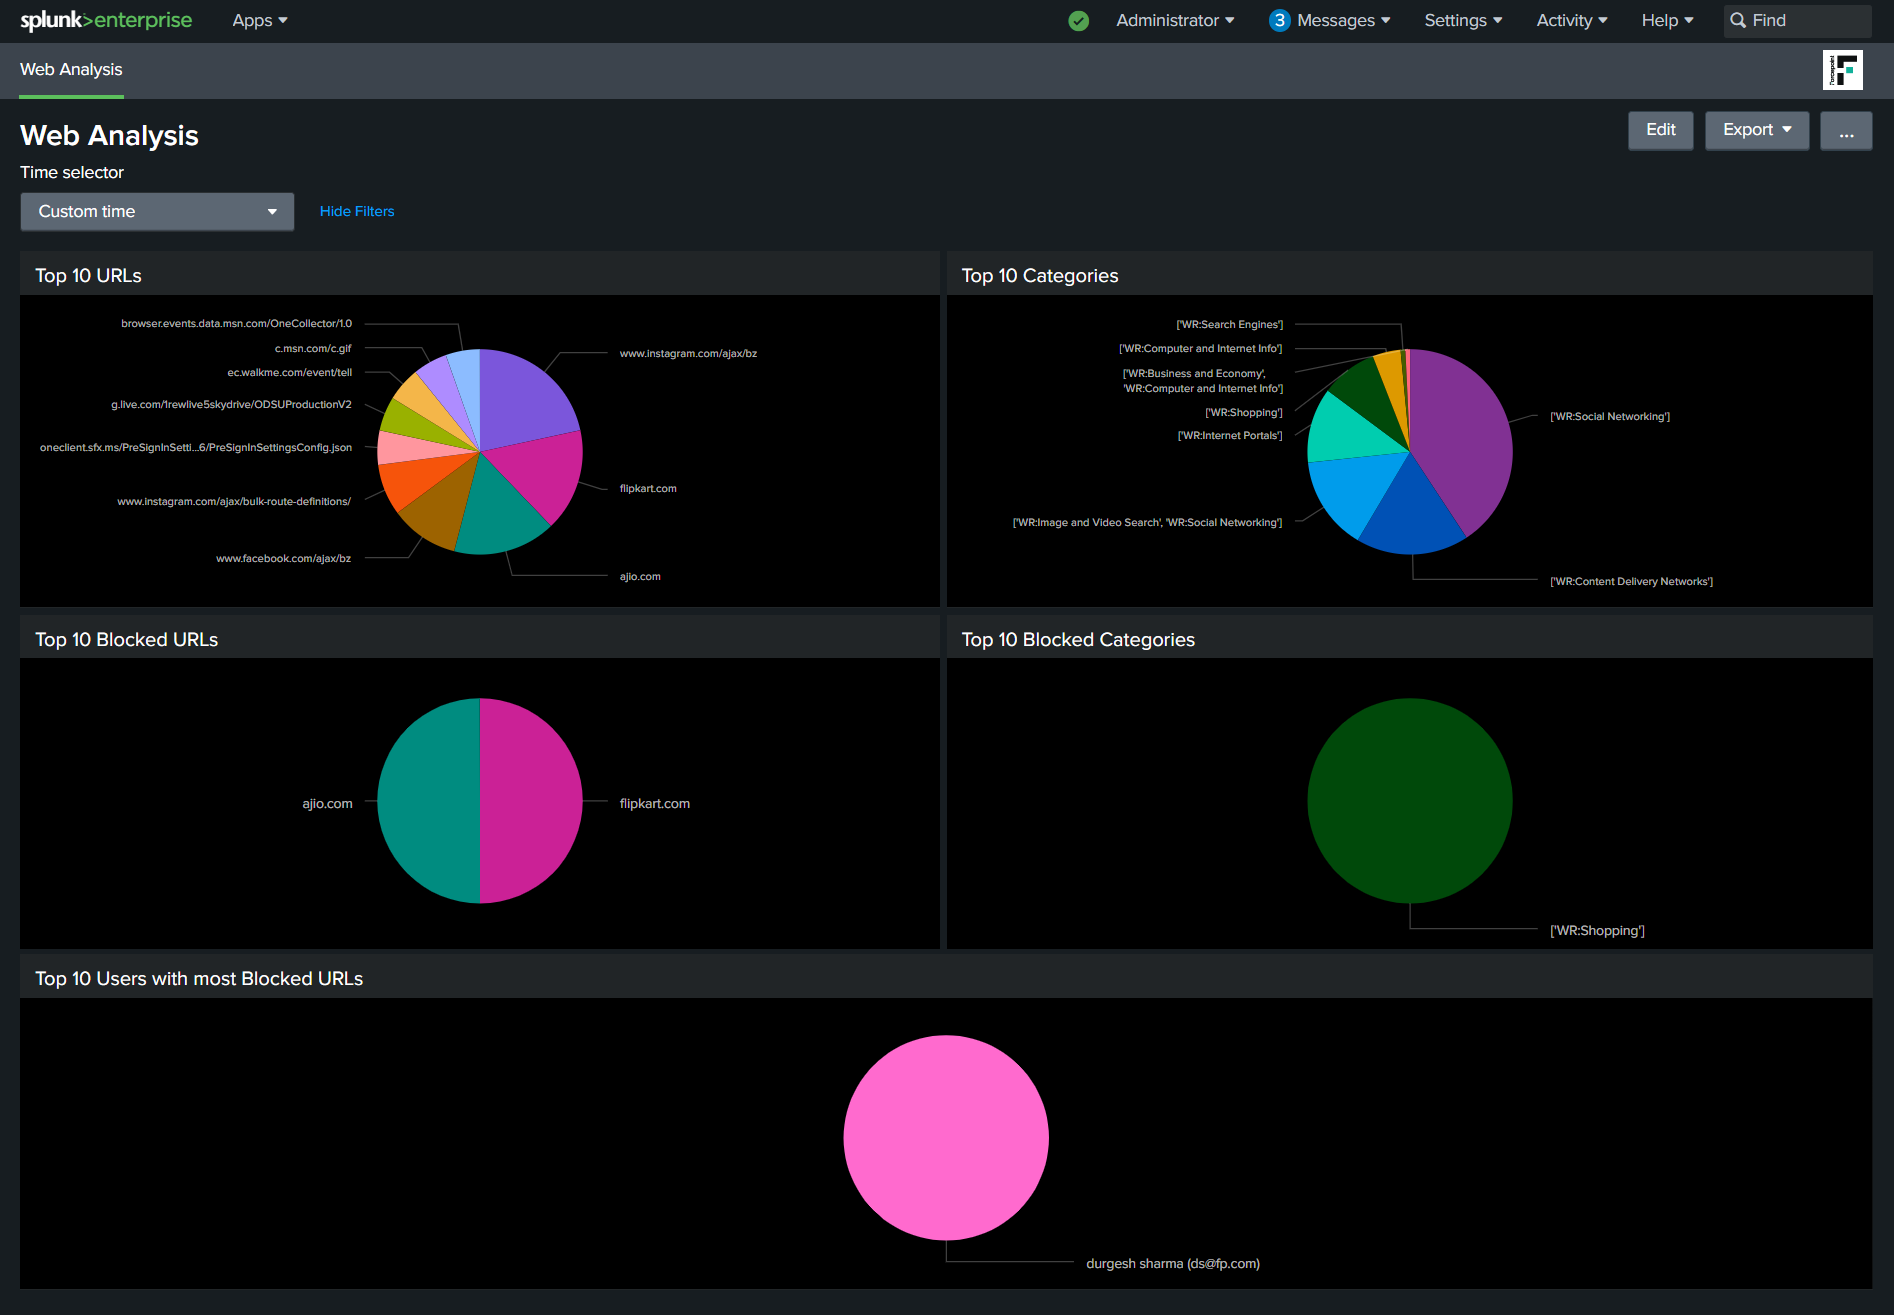
Once you click Save, you will be redirected to the Web Analysis Dashboard.
Wait for 10-15 minutes (based on your data volume) before logs are pulled over and you see log results.
