Assessing the need for additional policy engines
To check the number of transactions analyzed by a policy engine instance:
Steps
-
Select the policy engine instance, then review its “Analysis status” chart.
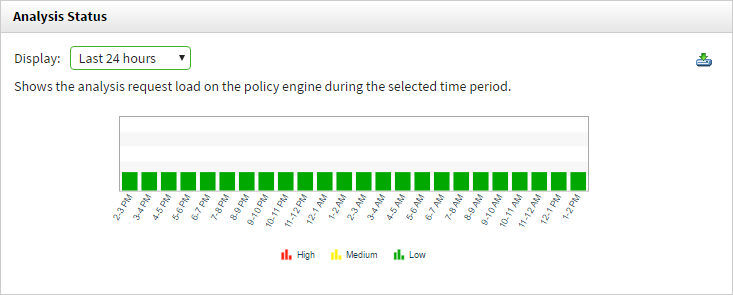
Red on the chart indicates a heavy load on the policy engine during the corresponding period.
In monitoring mode, a few red bars may not be an issue. The system will process the incidents during a less busy period.
In blocking mode, even one hour of red is undesirable. If a red bar appears, perform load balancing, and, if that does not resolve the issue, add a new Forcepoint DLP server.