Navigating the system
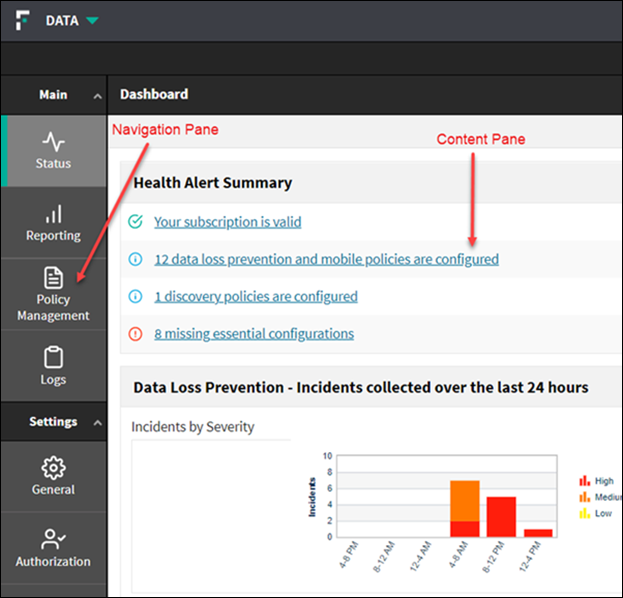
The Data Security module of the Forcepoint Security Manager is displayed in two panes:
- The left pane is called the navigation pane. Each item in the navigation pane offers a menu of options.
The navigation pane is divided into two sections:
- Main has options for creating and fine-tuning policies, performing discovery, managing incidents, and viewing system status and logs. See Main options section.
- Settings has options for administrating the system; performing system maintenance; and configuring endpoint deployment, settings, modules, and roles. See Settings options section.
Note: For Forcepoint Web Security or Forcepoint Email Security administrators, the tabs look slightly different. Options that require a full Forcepoint DLP subscription, such as discovery and
endpoint, are not shown.
- To the right of the navigation pane is the content pane. The content pane displays the feature selected in the navigation pane.
- The Dashboard is displayed in the content pane by default when an administrator logs on to the Data Security module of the Security Manager. It offers an overview of top Incident Risk Ranking cases, data loss prevention incidents, and discovery incidents over a specified time period. For details about the Dashboard and its contents, see Viewing the Dashboard section.
- Breadcrumb links are displayed at the top of the content pane, showing the navigation path to the current page. Each item in the path is a link, which can be used to navigate back to previous pages.
In the image below, Status is selected in the navigation pane, and the page appears in the content pane.