Application Health Monitoring Dashboard
The Application Health Monitoring dashboard displays the health status of the network applications that are being monitored.
It includes the following widgets:
- Application Heath: Displays the overall health status of network applications being monitored.
- Application Health Map: Displays the health status of applications that are monitored for the site on the map. You can hover over a site on the map to view more details.
- Application Latency Map: Displays the application latencies grouped by the geographical location of the application server IP address on the map.
- Network Latency Map: Displays the network latencies grouped by the geographical location of the application server IP address on the map.
- Application Health Tree: Displays the statistics that are reported for each monitored application.
- Top Application Latencies by Application: Displays the chart with details of applications with top application latency.
- Top Packet Loss by Application: Displays the chart with details of applications with top packet loss.
- Top Network Latencies by Application: Displays the chart with details of applications with top network latency.
- Application Health
- Application Latency Map
- Application Health Tree
Also, you can click the Statistics Time-Range icon in the upper-right corner of the Application Health Monitoring dashboard to select the time-range between which you want to view the health status history of network applications in the dashboard. The details in the widgets are updated as per the selected time-range.
- To monitor application layer latency on TLS encrypted traffic, the TLS inspection must be enabled for the monitored traffic.
- To accurately monitor health of the UDP traffic of an application that needs active probing, you must enable active monitoring for the applications in the access policy Action options. This allows the engine to use active probing as needed for the application traffic that match the rule of the access policy.
Figure: Application Health Monitoring Dashboard
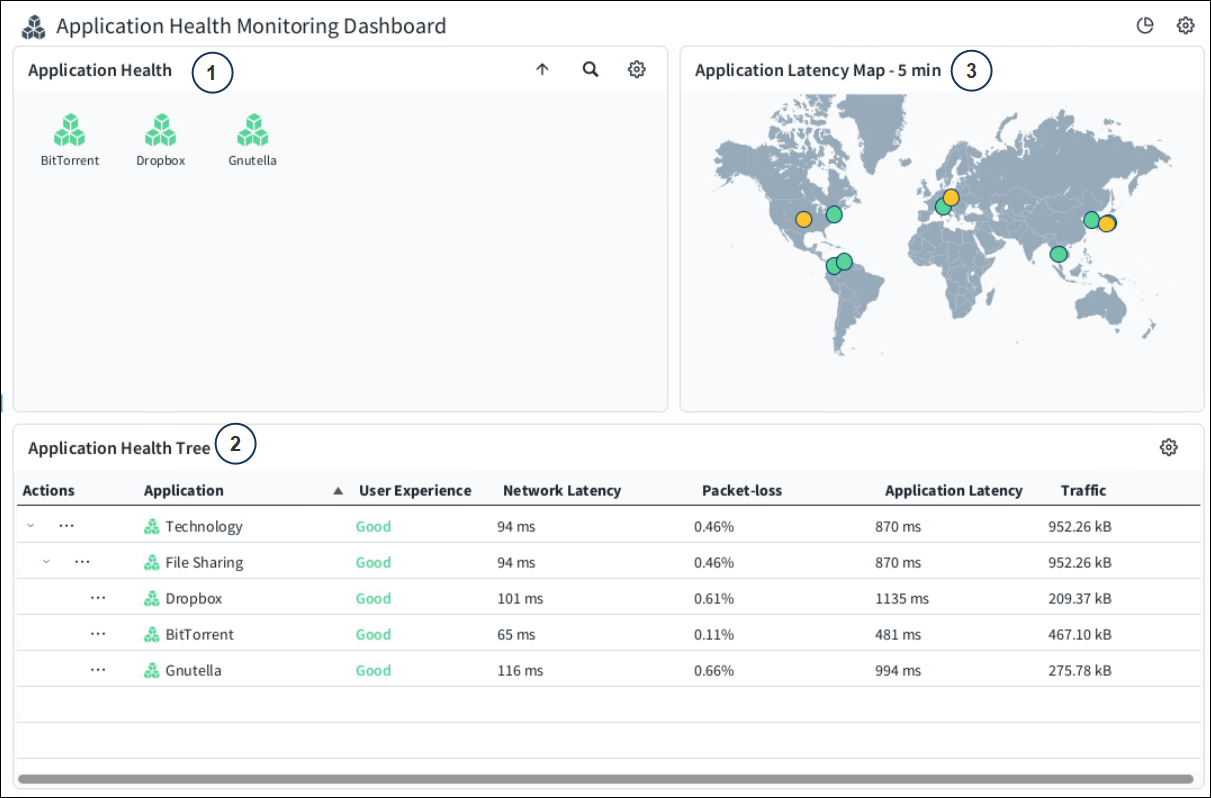
- 1
- Displays the overall health status of network applications being monitored and categorizes the applications as follows:
- Good (Green) – When all of the following is true:
- Application latency value is less than 1200 milliseconds.
- Network latency value is less than 150 milliseconds.
- Packet loss value is less than 70 per-myriad.
- Fair (Yellow) – When one of the following is true:
- Application latency value is more than 1200 milliseconds but less than 4800 milliseconds.
- Network latency value is more than 150 milliseconds but less than 250 milliseconds.
- Packet loss value is more than 70 per-myriad but less than 250 per-myriad.
- Poor (Red) – When one of the following is true:
- Application latency value is more than 4800 milliseconds.
- Network latency value is more than 250 milliseconds.
- Packet loss value is more than 250 per-myriad.
Also, you can do the following from the Application Health widget:- You can hover over an application to view more details related to the application health.
- You can hover over an application, and then click one of the following icons:
- Logs by situation icon: Opens the Logs page with the log details filtered for the application.
- Connections icon: Opens the Connections page with the network application details for the application.
- Status History icon: Opens the Application health status history dashboard. Its displays the health status history trend, network latency, application latency trend, packet loss trend, traffic trend, and connection trend for the application. Also, you can select the time interval from the drop-down list in the upper-right corner of the dashboard to display the application health monitoring information for the selected time interval.
- Good (Green) – When all of the following is true:
- 2
- Displays the application latencies grouped by the geographical location of the application server IP address on the map..Note: You can hover over a site on the map to view more details related to all applications for the site.
- 3
- Displays the following statistics that are reported for each monitored application:
- Action Menu: Click the … menu under the Action column in a specific row to view the following
action options for each application or application category:
- Logs by Situation: Opens the Logs page with the log details filtered for the application.
- Connections: Opens the Connections page with the network application details for the application.
- Status History: Opens the Application health status history dashboard. Its displays the health status history trend, network latency, application latency trend, packet loss trend, traffic trend, and connection trend for the application. Also, you can select the time interval from the drop-down list in the upper-right corner of the dashboard to display the application health monitoring information for the selected time interval.
- Application: Displays the application category name or the application name.
- User Experience: Displays the overall application experience impacted by network and application latency, traffic transfer rate and any packet loss in transmission. The values that are displayed are Good (green), fair (yellow), and poor (red). Also, the time is displayed along with the user experience value to indicate when the last status change has occurred. For example, the Fair (5 min) value indicates that the status has changed from Good to Fair 5 minutes ago.
- Network Latency: Display the amount of time in milliseconds, the data packet takes to travel across the network for each application based on application health monitoring values received from engines during a periodic interval. By default, 5 minutes is used as the periodic interval to receive the application health monitoring values, which can be customized in SMC configuration file.
-
Packet-loss: Displays the percentage of packets that are lost after being transmitted across the network for each application based on application health monitoring values received from engines during a periodic interval. By default, 5 minutes is used as the periodic interval to receive the application health monitoring values, which can be customized in SMC configuration file.
- Application Latency: Display the amount of time in milliseconds, the application takes to respond based on application health monitoring values received from engines during a periodic interval. By default, 5 minutes is used as the periodic interval to receive the application health monitoring values, which can be customized in SMC configuration file.
- Traffic: Displays the average transfer rate of traffic in the network for each application based on application health monitoring values received from engines during a periodic interval. By default, 5 minutes is used as the periodic interval to receive the application health monitoring values, which can be customized in SMC configuration file.
- Action Menu: Click the … menu under the Action column in a specific row to view the following
action options for each application or application category: