
Viewing Violations by Classification
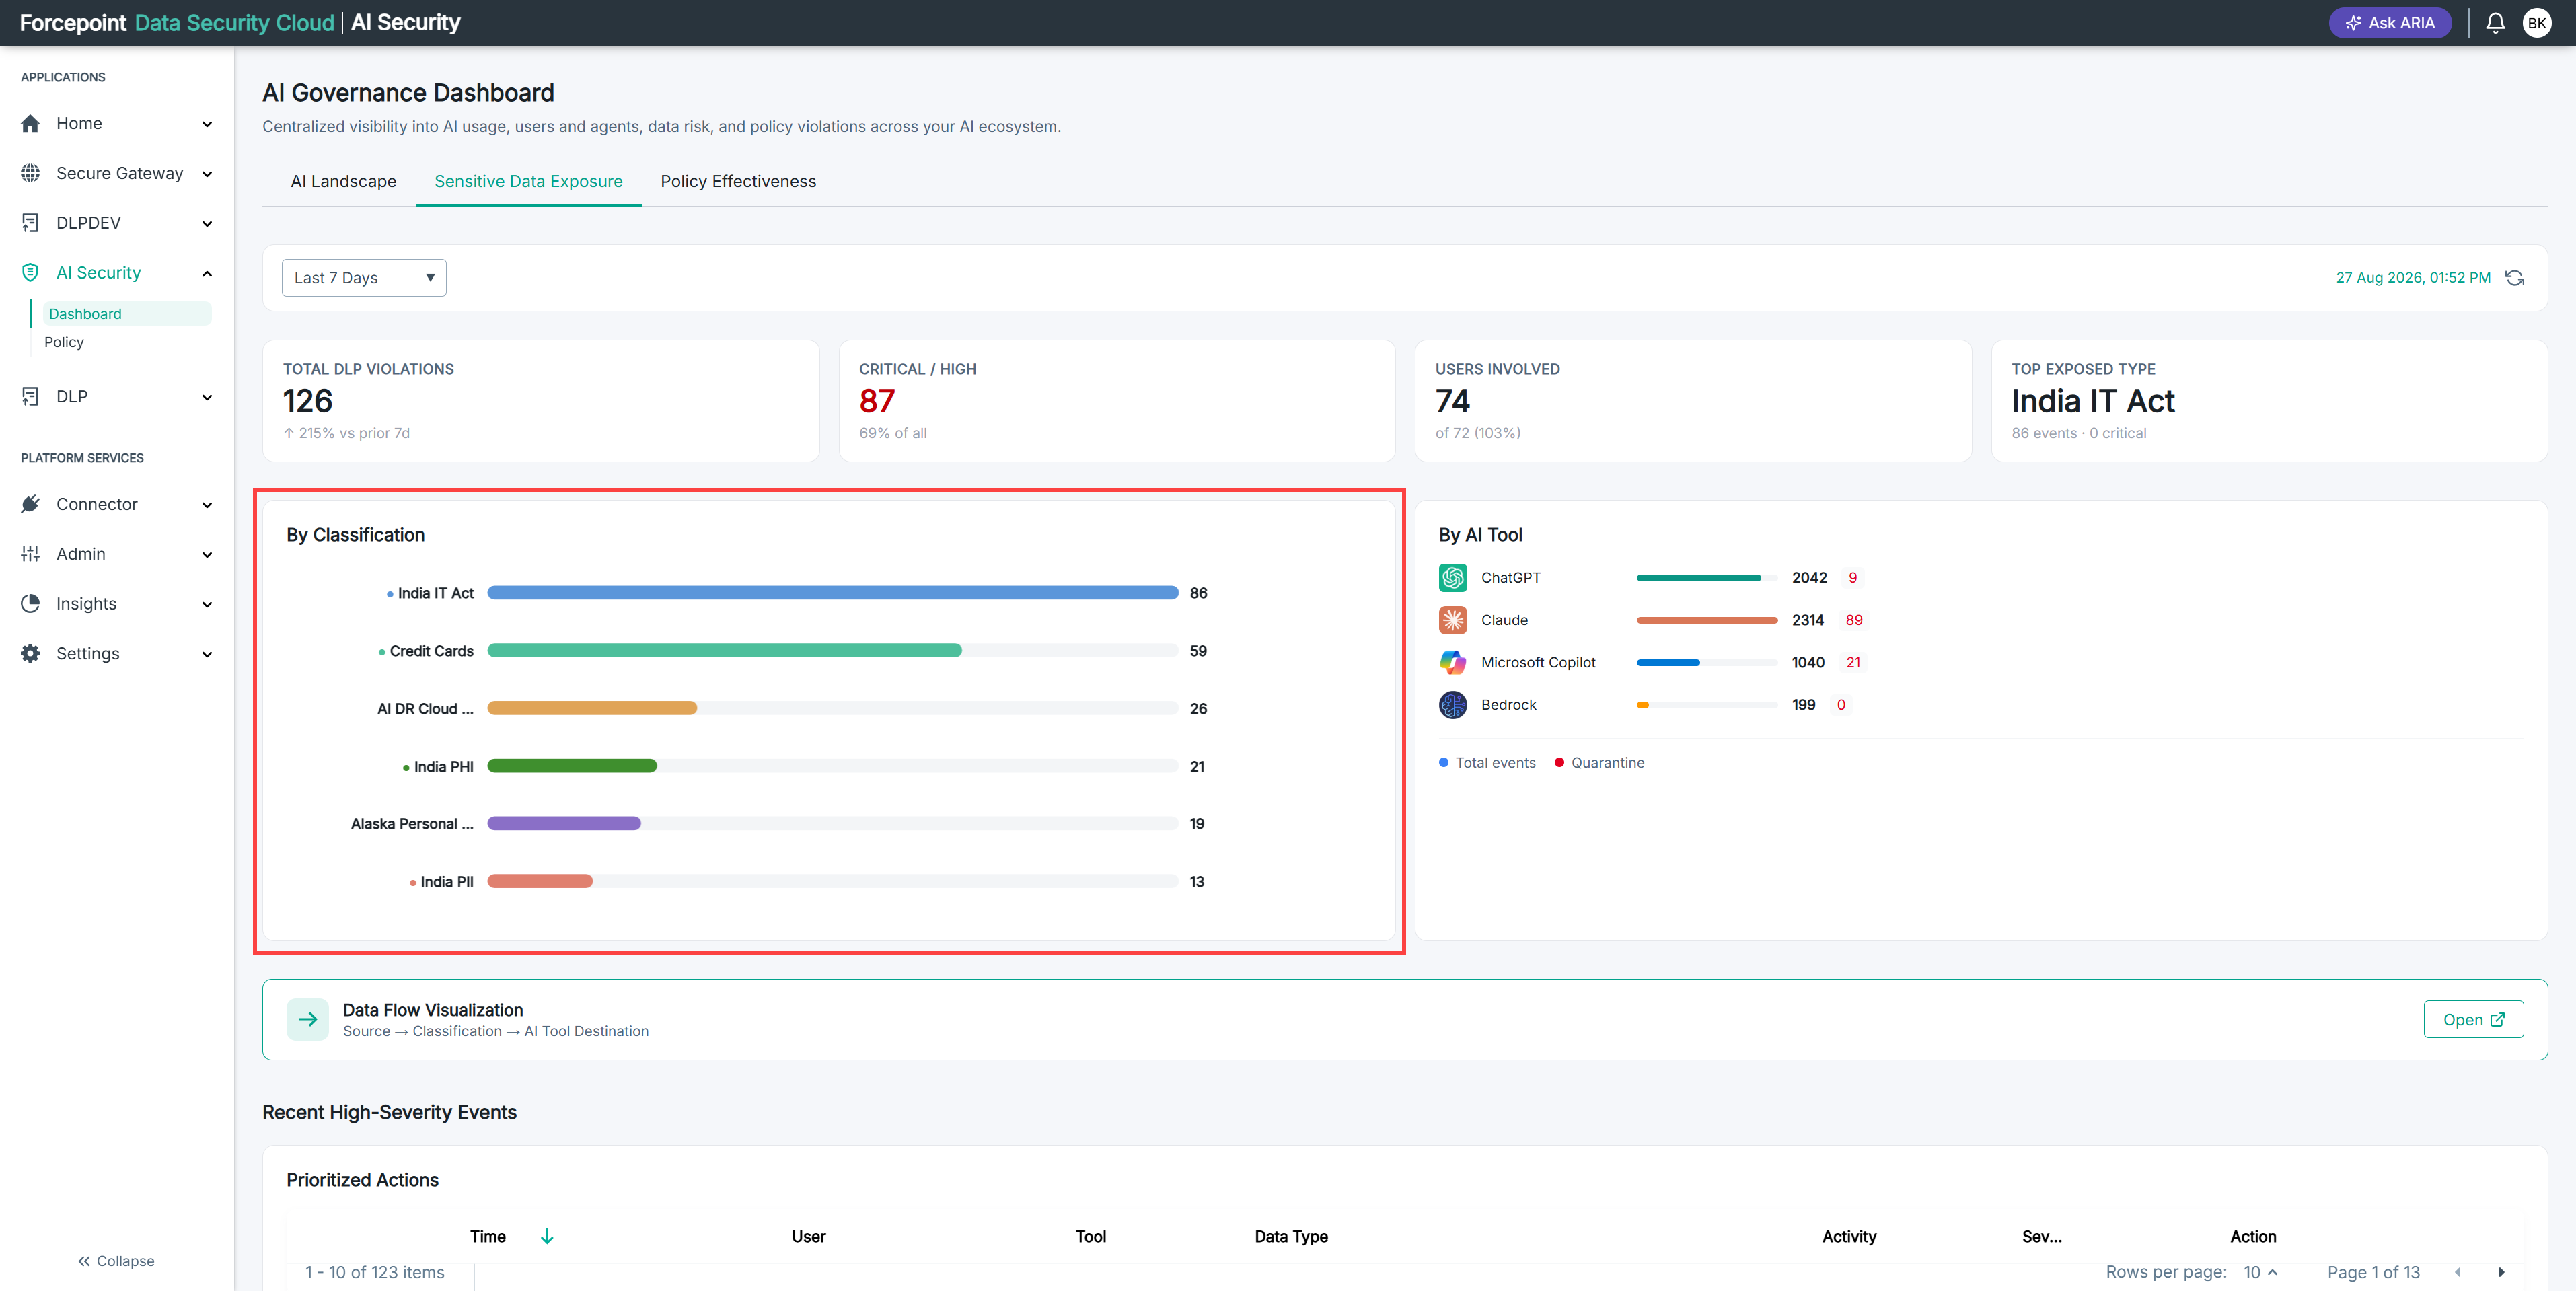
View the By Classification chart to see which kinds of sensitive data your users are sending to AI applications.
Before you begin
You are on the Sensitive Data Exposure tab.
The By Classification chart ranks the categories of sensitive data that were exposed, highest first, with a violation count against each bar. The longer the bar, the more of that kind of data is leaving your organization.
The following figure shows the chart with the bars ranked.
Steps
-
Go to the By Classification section.
-
Read the name and the violation count against the top bar.
This is the kind of sensitive data your users are sending to AI applications most often.
-
Compare the length of each bar below it against the top bar.
One bar far longer than the rest points to a single kind of data to address first. Bars of similar length point to a broad habit across your organization rather than one problem.
Result
You know which kinds of sensitive data are leaving your organization, and whether your exposure is concentrated in one kind or spread across several.
Next steps
To find out which specific rules produced a classification's count, see Reviewing Violations by Classification.
For what a classification is and what each kind covers, see Understanding What Each Classification Covers.