What the Logs view shows
The Logs view can show entries generated by any SMC components and third-party components that send data to the SMC.
Depending on the permissions defined for your administrator account, the logged data can also include alert and audit entries. There are four different arrangements:
- Records
- Statistics
- Details
- Log Analysis
Panes in the Logs view
You can select and deselect panes from ![]() Menu > View > Panels.
Menu > View > Panels.
- Fields pane — Provides quick access to categorized log entry details.
- Query pane — Allows you to filter the log entries so that you can find the information you need. You can filter the data by any combination of details that exist in the records.
- Task Status pane — Only available in the records arrangement. Shows the status of log-related tasks, such as a log export that you start from the Logs view.
- Hex pane — Shows traffic recordings generated by the Excerpt logging option of an Inspection rule (other recordings are viewed using an external viewer).
- Summary pane — Textual explanation of the event that generated the record.
- Event Visualization pane — A graphic showing important information about the event.
- Info pane — Shows detailed information about a selected log entry.
Status bar in the Logs view

- 1
- Activity status
- 2
- Server connectivity status
- 3
- Set the time zone
- 4
- The logged in user
- 5
- The location — defines the Log Server contact address if there is NAT between the Management Client and a Log Server
The Logs view in the Statistics arrangement
The Statistics arrangement allows you to generate basic summaries of the log data currently shown in the Logs view.
The basic summaries are similar to the charts in overviews, and include the ability to drill into the logs through individual chart items.
Figure: Statistics arrangement

In the Statistics arrangement of the Logs view, you can view charts of multiple events interactively. You can create a quick report of the log entries that match the active query. You can then further refine the query by viewing log entries that correspond to a chart segment.
The Query pane in the Statistics arrangement includes another Section tab. You can use the tabs to control the statistical display. The data can also be filtered in the same way as in other arrangements.
Figure: Toolbar in the Statistics arrangement
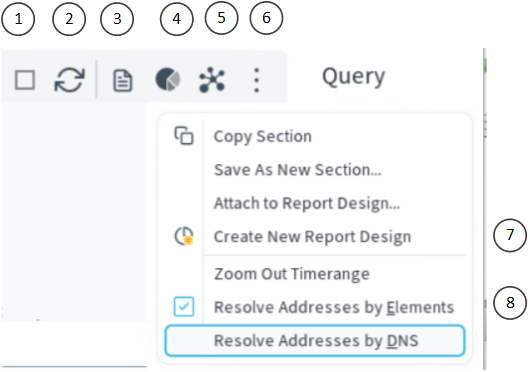
- 1
- Stop the ongoing operation
- 2
- Refresh
- 3
- Show the Records arrangement
- 4
- View graphical summaries based on the log entries
- 5
- Opens the Log Analysis view
- 6
- Opens the Tools menu
- 7
- Options for creating new sections and reports
- 8
- Generate a new chart with a wider time range
- Top rate charts can be displayed as a pie chart, bar chart, or a map. A top rate chart shows the total numbers of records that match the query.
- Progress charts can be displayed as a line chart, stacked line chart, bar chart, or stacked bar chart. A progress chart illustrates the numbers of records plotted over time (similar to the timeline, but in more detail).
- Show Records — Opens the Records arrangement filtered to show the entries that comprise the chart section you right-clicked.
- Add to Current Filter — Allows you to use sections to filter data by adding the section in question to the Filter tab of the Query pane.
- Statistics item shortcuts — Drill down to create a chart from data that matches the previous chart section.
The Logs view in the Details arrangement
The Details arrangement shows an overview of an individual log entry.
Figure: Details arrangement

Figure: Toolbar in the Details arrangement
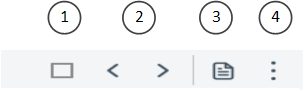
- 1
- Stop the ongoing operation
- 2
- Previous or next record
- 3
- Show the Records arrangement
- 4
- Opens the Tools menu
- References pane (shown by default) — Displays a list of elements corresponding to the details in the record and possibly more information about related records for some special records that are part of a larger event.
- Tasks pane — Shortcuts to configuration tasks that you can start based on the displayed entry (as in the Records arrangement in the right-click menu for entries).
The Logs view in the Log Analysis arrangement
The Log Analysis arrangement provides various tools to analyze and visualize log data.
For example, you can combine logs by service or situation, sort logs by column type, view the data as charts or diagrams. The various tools make it easier to notice patterns and anomalies in traffic.
Figure: Log Analysis arrangement

- To combine logs by Service or Situation, select or .
- To sort logs by column type, select , then click the heading of the corresponding column.
- To view the data as charts, click Statistics, then select one of the predefined statistical items. Select Select to select an item from a complete list of statistical items.
- To view the data as a diagram, click Visualizations, then select one of the visualization options.
Table 1. Visualization options Option Explanation Attack Analysis Displays information on Situations of the type Threat - 1st Class Accuracy or Suspicious Traffic - 1st Class Accuracy. Indicates allowed and disallowed connections between users and applications. Audit Map Displays information on how users manipulate elements. Application and Executable Usage Displays users and the applications that they use or access. Indicates allowed and disallowed connections between users and applications. Service Map Displays access to services in the network.
You can zoom in on the data presented in the visualization diagrams with the mouse wheel. Right-clicking elements in the diagrams opens a pop-up menu with various options to further analyze the elements and add them to filters. You can also, for example, drag and drop objects from the visualization diagram to the Query pane to create a filter.