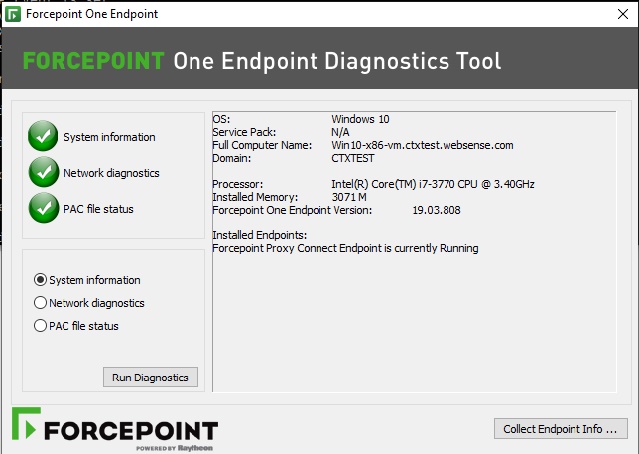
Using the Forcepoint Web Security Endpoint Diagnostics Tool
The Diagnostics Tool displays all information about the Forcepoint Web Security Endpoint that you can provide to your system administrator to assist with troubleshooting.
To launch the Diagnostics Tool:
- Right-click the F1E icon in the task bar’s notification area (Windows) or single click the menu bar’s status menu (Mac).
- Select Open F1E Diagnostics.
When the tool is launched, the diagnostic tests are executed in sequence. If one of the tests results in a failure, the subsequent tests are not automatically run.
Three diagnostic tests are accessed from this tool:
- System information - Collects basic information related to the specific endpoint machine on which the Forcepoint Web Security Endpoint software is installed.
- Network diagnostics - Collects information related to network connectivity.
- PAC file status (Windows only) - For endpoint machines that go through a proxy before connecting to the Internet, this test collects information to determine if the PAC file is accessible.
OR
Cloud services - For endpoint machines that connect directly to the Internet, this test collects information to determine if the endpoint software can contact the cloud service for disposition information (i.e., whether to block or allow the request).
To manually run the diagnostics tests, select one of the above tests and click the Run Diagnostics button.

Note: Corresponding log files generated from these new diagnostic tests can easily be collected with the existing CLIENTINFO.EXE tool. Your Help Desk might ask you to run this
tool to collect these files. To run it, click the Collect Endpoint Info... button on the diagnostics screen. The resulting file is placed onto the desktop. Attach the file
to an email to your Help Desk or system administrator.