The dashboard
The dashboard displays on initial login to the Email Security module of the Forcepoint Security Manager and provides access to charts detailing metrics for the Forcepoint Email Security product.
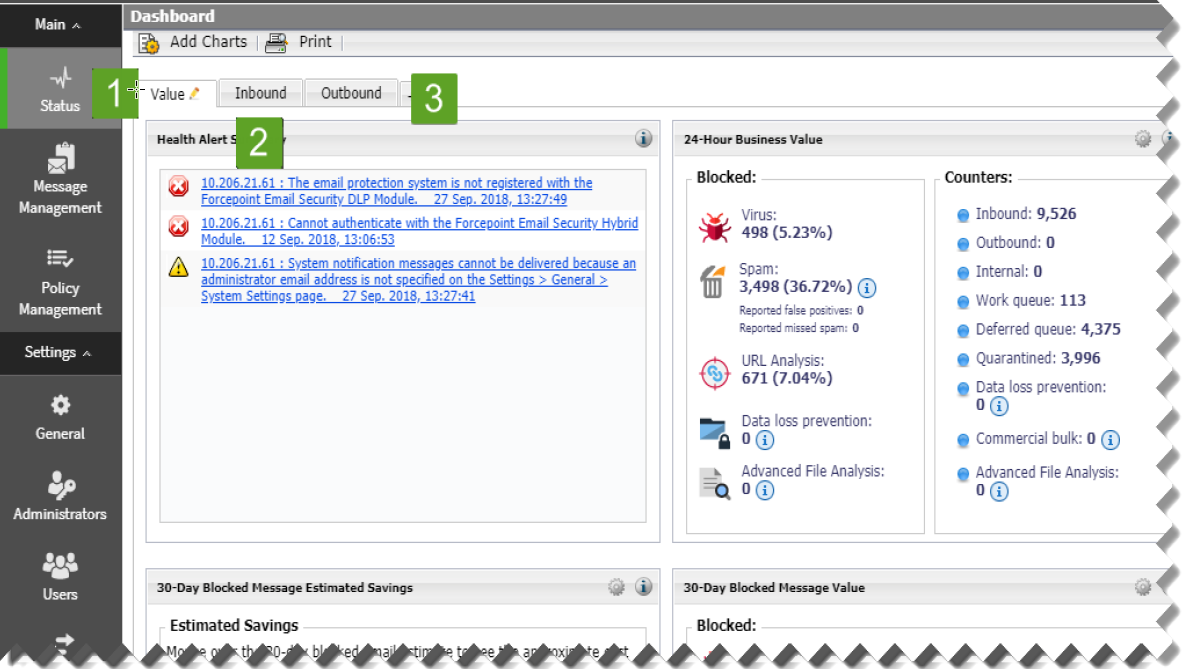
The dashboard includes three default tabs.
The following image displays the dashboard in version 8.5.3:
The following image displays the dashboard in version 8.5.4:
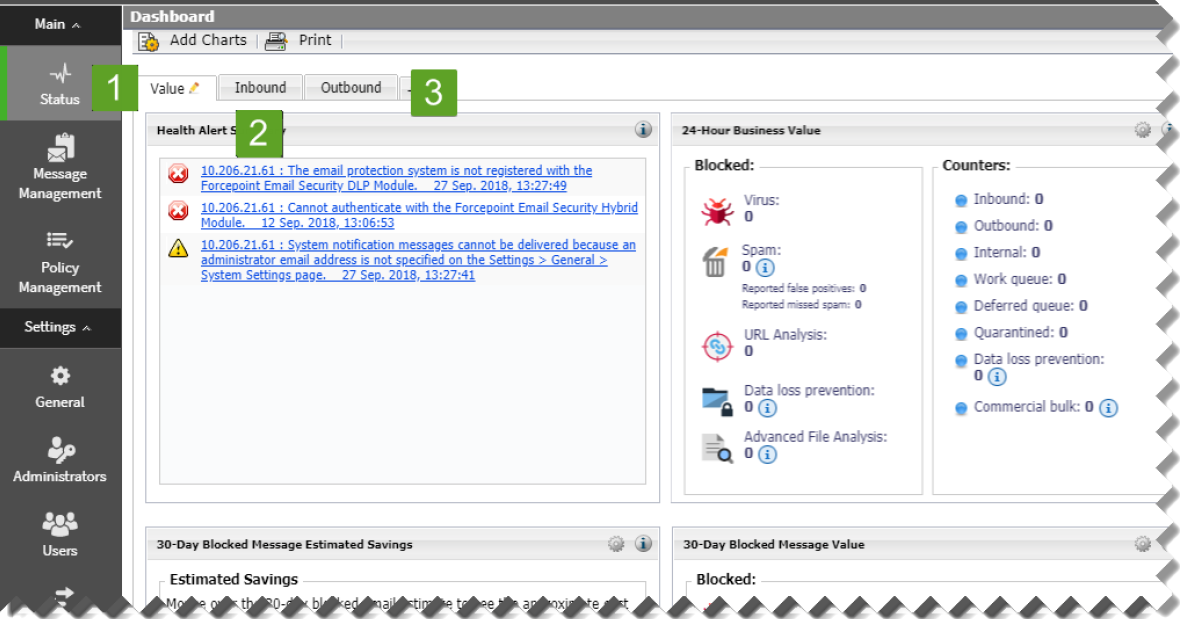
- The Value dashboard tab (1) displays on first login and shows information about the value of Forcepoint Email Security in the network, along with a summary of system health alerts.
- The Inbound dashboard tab (2) shows graphical charts that display top domains and message recipients for inbound email. Top domain and recipient information is sorted by message size or volume.
- The Outbound dashboard tab (3) shows graphical charts that display top senders for outbound email, sorted by message size or volume. Other default charts for this tab show an overall outbound message summary and a summary of outbound messages that contained embedded URLs.
Dashboard elements are visible to Super Administrators and those delegated administrators with permission to view reports on the email dashboard (see Managing administrator accounts). The type of information and level of detail shown depends on your subscription level. For example, the Forcepoint Email Security Hybrid Module is required to display information about the email hybrid service and how it safeguards your system. Forcepoint Advanced Malware Detection for Email - Cloud must be purchased to view metrics on advanced file analysis functions in the cloud; Forcepoint Advanced Malware Detection for Email - On-Premises must be purchased to view advanced file analysis appliance metrics. The following table details the options available on the dashboard.
| Icon | Option | Description |
| Add Charts | Selection displays the Add Charts page to add elements to the Value, Inbound, Outbound, or any custom dashboard tab. See Adding elements to a dashboard tab. | |
| Selection displays a secondary window with a printer-friendly version of the charts displayed on the tab. Browser options are used to print the page. | ||
| Save |
Selection saves dashboard changes, such as adding, moving, or editing charts. The Save button only activates when changes are made to the dashboard. Save any changes before navigating away from the dashboard. |