Monitoring users on the Dashboard
In the Dashboard view of the Management Client, there are user dashboards where you can see an overview of user activity.
For example, you can see if there is any activity that indicates suspicious behavior, such as the use of certain network applications, attempts to access specific networks, or if a user has been associated with an attack Situation.
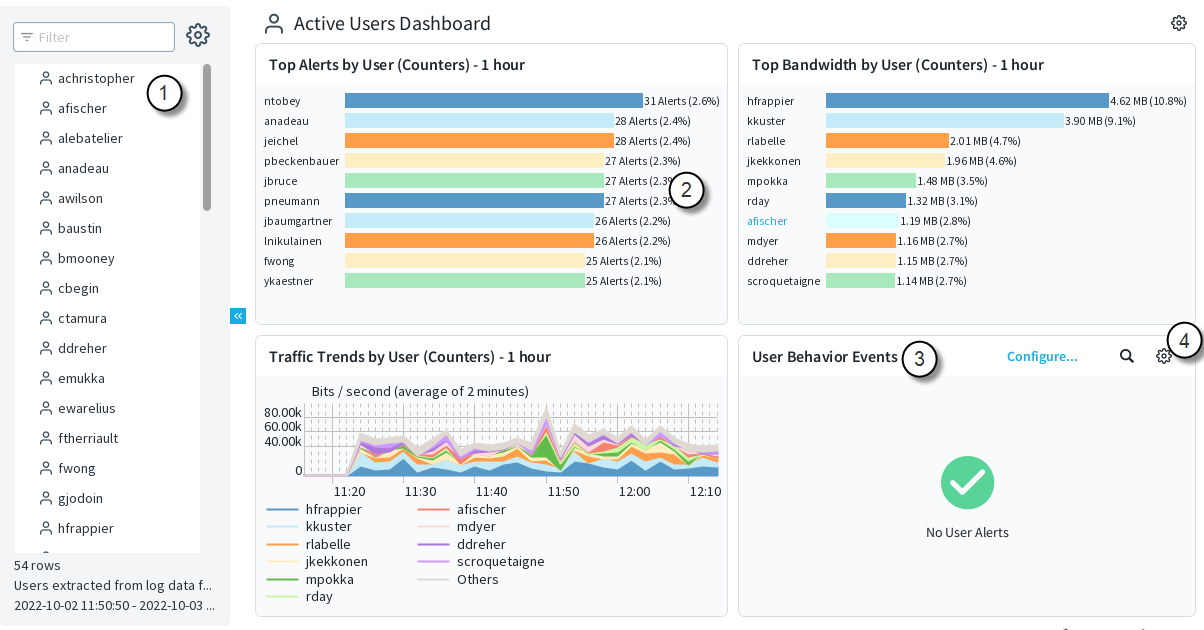
Figure: User dashboard

- 1
- When users have been active and have caused log data to be generated, they are shown in the Users list. You can configure the time period within which a user
must have been active. If there are no user names stored in log data, or in regions where privacy laws require that users must not be easily identified, you can show the IP
addresses of users instead of their names.Note: To be able to monitor users by name, you must enable the logging of user information in the Engine IPv4 and IPv6 Access rules.
- 2
- The Statistics panes contain charts and general statistics of user activities, and if you select an individual user, you can see more detailed information about the user and their activities. If user information from Active Directory (AD) and the Endpoint Context Agent (ECA) service is available, the information is shown in separate panes in the Dashboard view.
- 3
- The User Behavior Events pane shows alerts related to User Alert Checks. There are a set of system User Check Alerts, and you can add your own custom alerts. After configuring the rules, the generated alerts are shown here.
- 4
- The
Tools menu allows you to organize the information in the pane by Activity, User, User Alert Check Type, User Alert, and Severity.
Follow these general steps to configure showing users in the Dashboard view:
- Enable the showing of user information in the Dashboard view.
- (Optional) Create custom User Alerts.
- Define rules that generate User Alerts.