What the Secure SD-WAN dashboard shows
The Secure SD-WAN dashboard allows you to monitor Secure SD-WAN features, such as Multi-Link and VPNs, and to view statistics and reports related to SD-WAN features.
Branches represent the VPN gateways and NetLink elements associated with each Secure SD-WAN Engine. The SD-WAN dashboard summarizes status information for all branches and VPNs. Various statistics items related to SD-WAN monitoring are available when you customize the SD-WAN dashboard. You can also use these statistics items in Reports and Overviews.
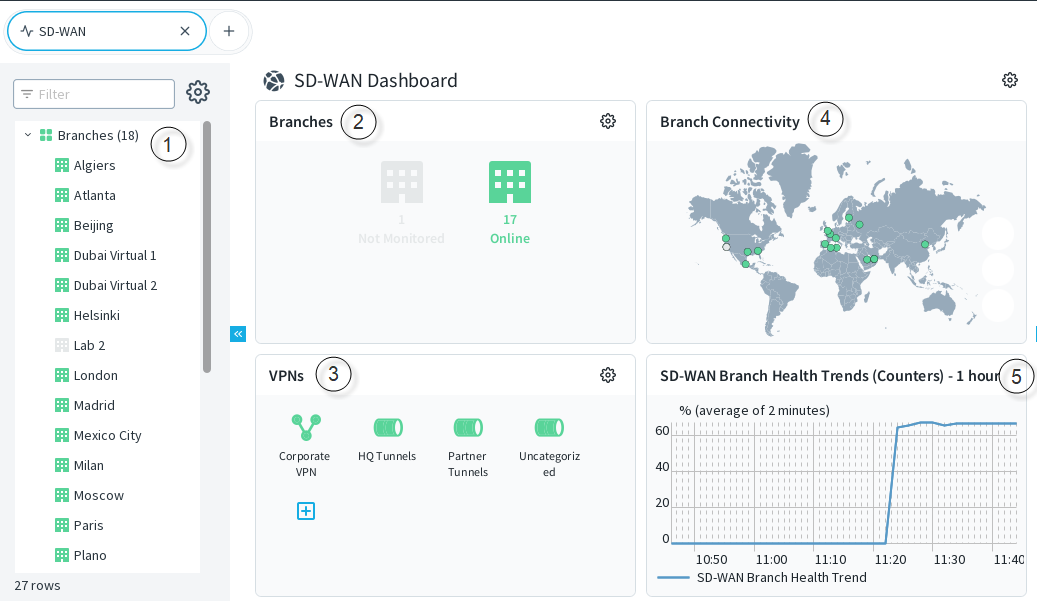
Figure: SD-WAN dashboard
- 1
- The status tree shows the status of monitored branches, route-based VPN tunnels, and policy-based VPNs. A branch is shown for an Secure SD-WAN Engine if the Secure SD-WAN Engine has SD-WAN gateways that are used in a policy-based SD-WAN or route-based SD-WAN tunnel, or if NetLinks associated with the Secure SD-WAN Engine are used in an Outbound Multi-Link element.
- 2
- Contains status cards that show information about the SD-WAN health and NetLink status of each branch. When you select an individual branch, the Dashboard view shows detailed monitoring information about the NetLinks, SD-WAN tunnels, and traffic associated with the branch.
- 3
- Shows the overall status of VPNs and the status of gateways and tunnels in the VPNs. When you select an individual policy-based VPN or group of route-based VPN tunnels, the Dashboard view shows detailed monitoring information about the policy-based VPN or route-based VPN tunnels.
- 4
- Shows the status of all monitored branches on a map.
- 5
- Shows how the health has changed over time.