Viewing ZTNA connectors
All the installed and configured ZTNA connectors can be seen under page.
After installing and configuring the ZTNA connector on the server, you can monitor ZTNA connector's health and data flow under .
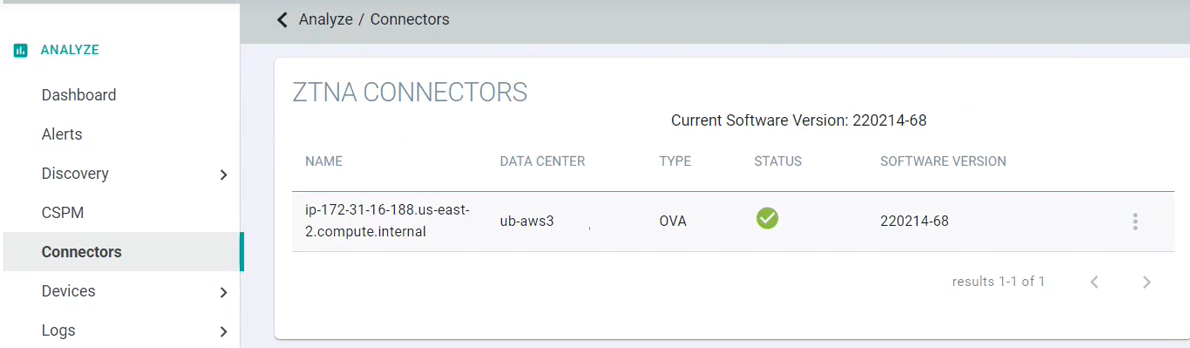
When the ZTNA connector is properly connected to server, it shows green checkmark under Status column. Otherwise, it shows red crossmark.
Click on the connector to view various details of the ZTNA connector.
The actual CPU, memory, machine load and so on of your connectors is displayed, which provides more accurate guidance for sizing the connector for your specific applications using that connector.
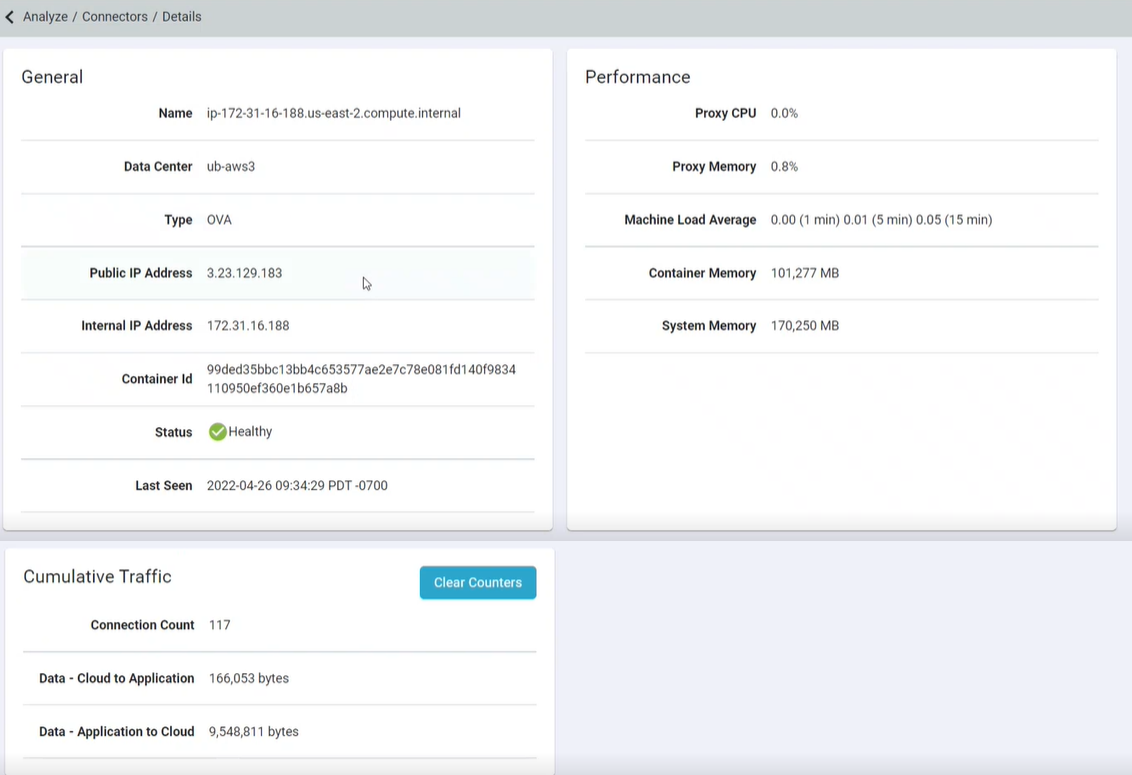
You can click Clear Counters under Cumulative Traffic section to clear the data flow values and to monitor whether the data is flowing or not.