Forcepoint Data Security Cloud | SSE provides a QRadar app within the QRadar hub for easily integrating with Forcepoint Data Security Cloud | SSE's REST API
for pulling Forcepoint Data Security Cloud | SSE logs into QRadar.
You will first need to create an Access Point in Forcepoint Data Security Cloud | SSE and then download the Forcepoint ONE App from the QRadar app
hub before you install the extension into your QRadar setup. Once installed, you can then configure the setup to start pulling logs.
Steps
-
On Forcepoint Data Security Cloud | SSE, create an Access Point.
-
Open a new browser tab or window, navigate to the QRadar App Hub:
-
Login with your IBM account.
-
Search for Forcepoint ONE App in the search bar and select the app that appears in the results.
-
Select Download to download the zip file with the application that you will need to install in your IBM QRadar instance.
-
Open a another new browser tab or window, login to your IBM QRadar instance with Admin privileges.
-
Navigate to :
-
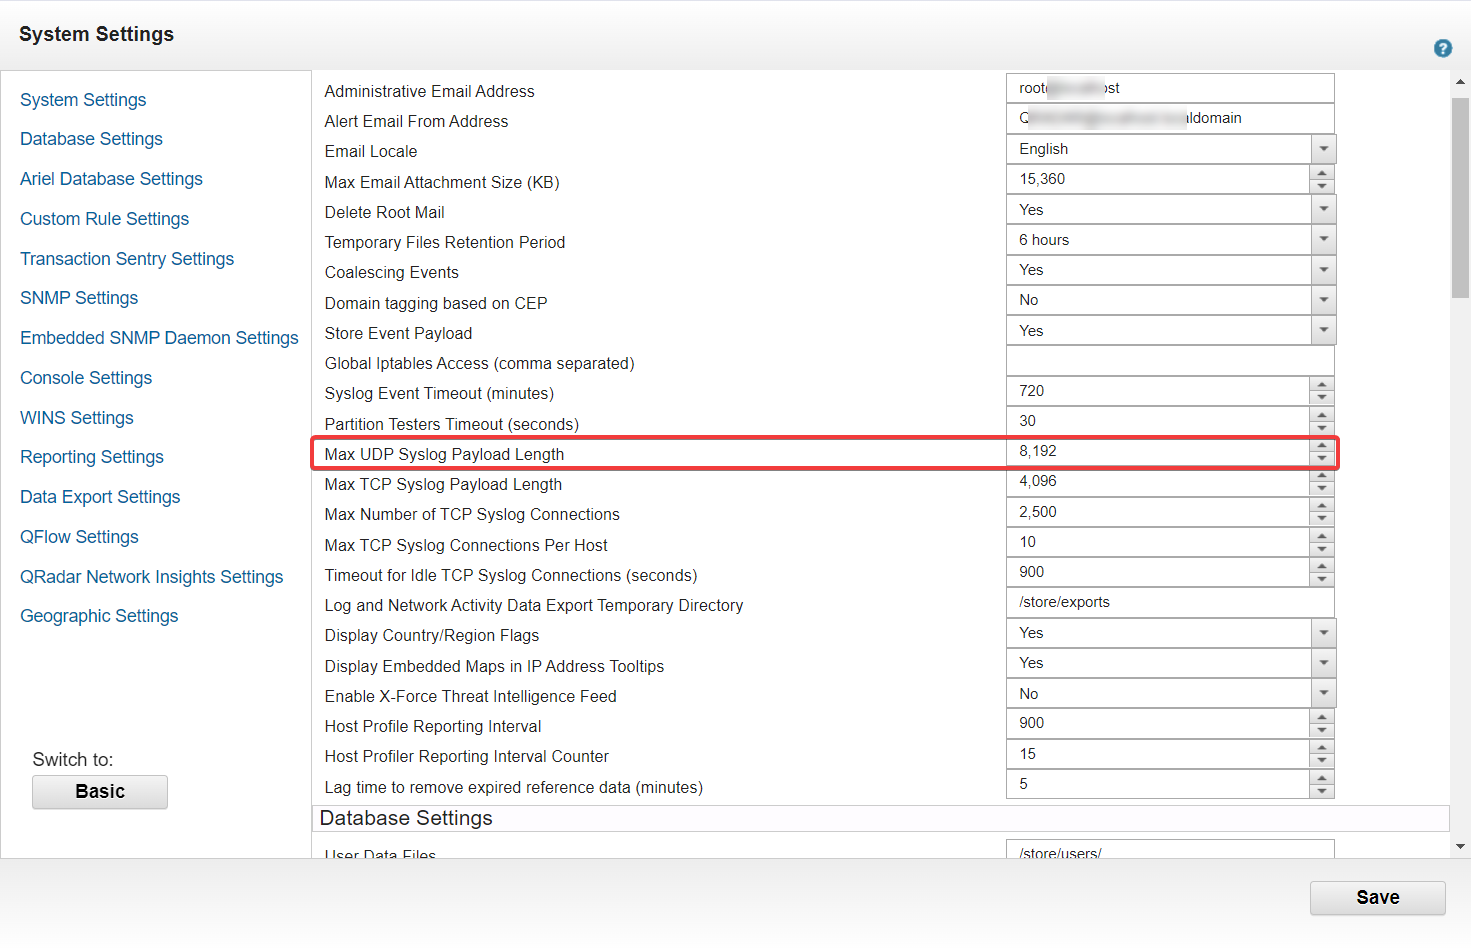
Change the Max UDP Syslog Payload Length field to 8192.

Note: Currently, Forcepoint recommends setting UDP server URL and does not support TCP.
-
To save the changes, click Save.
-
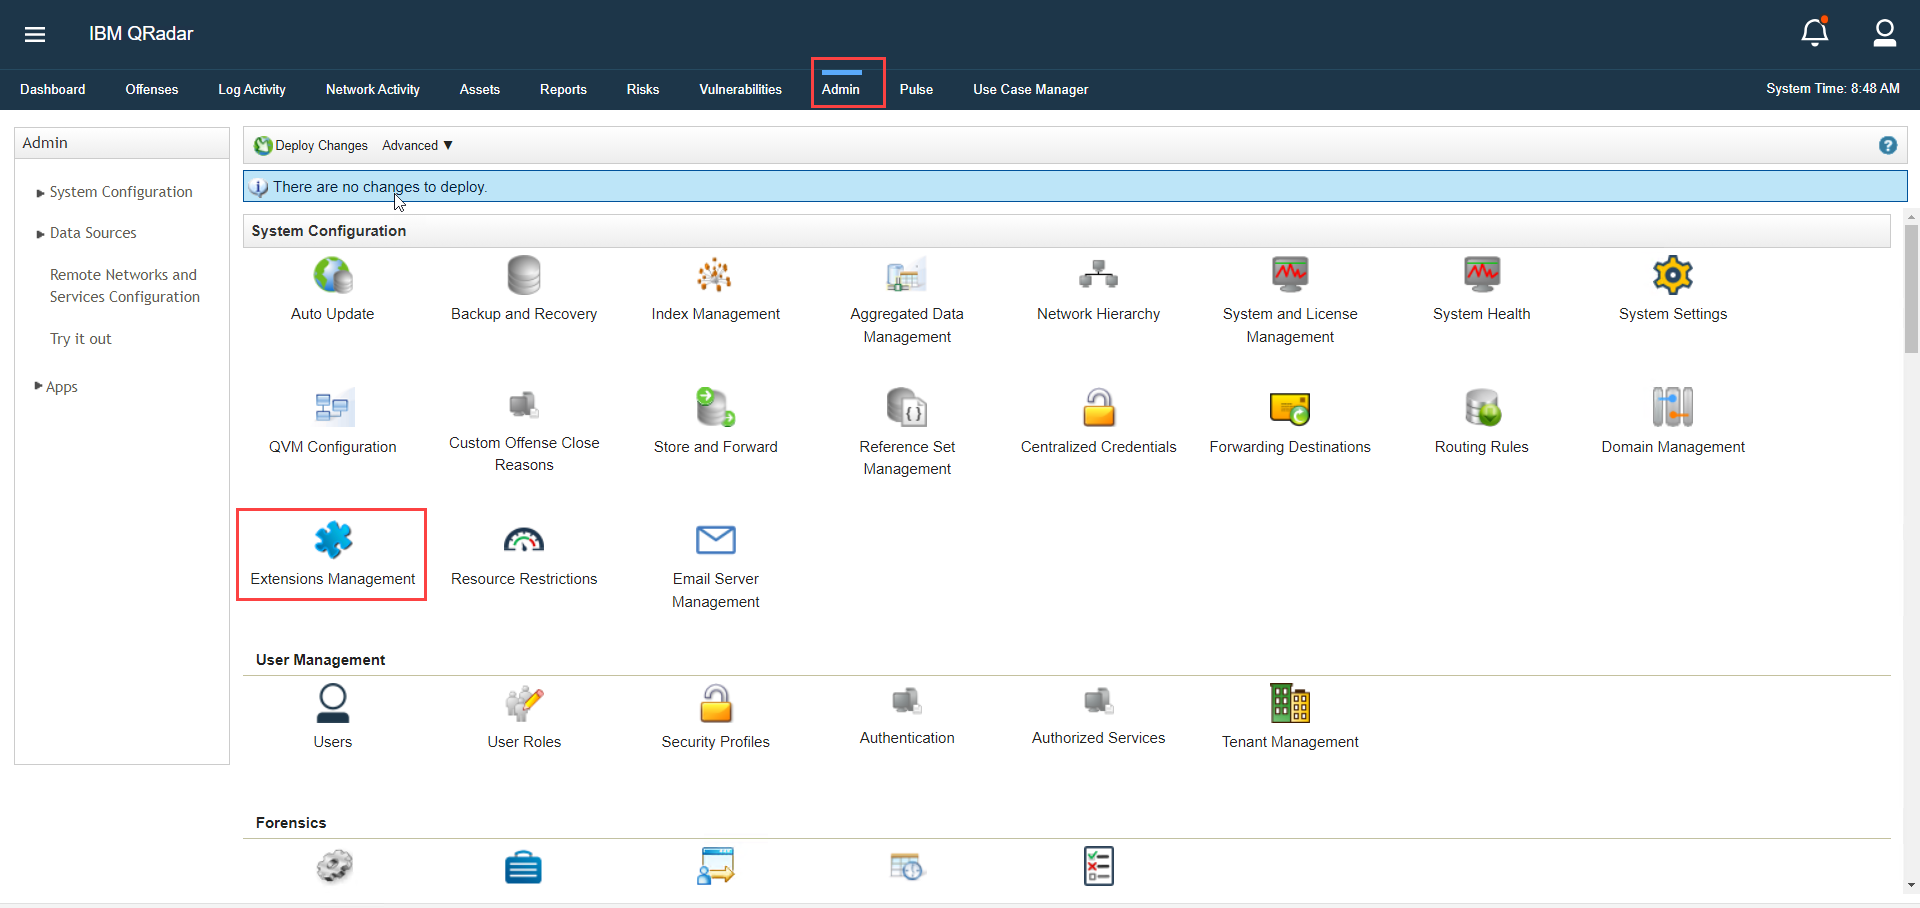
On the Admin tab, click Extension Management.
-
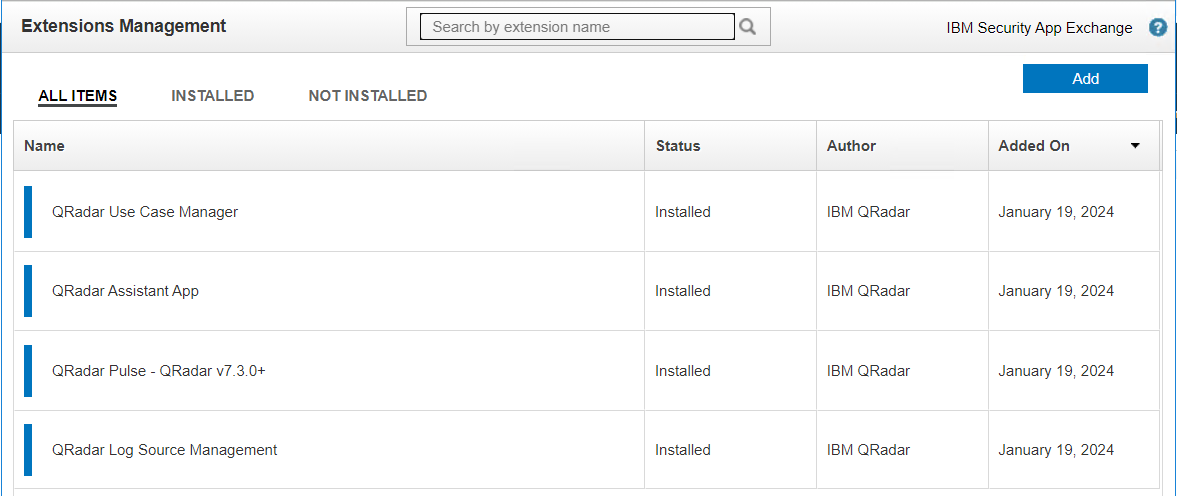
On the Extension Management page, click the Add button.
-
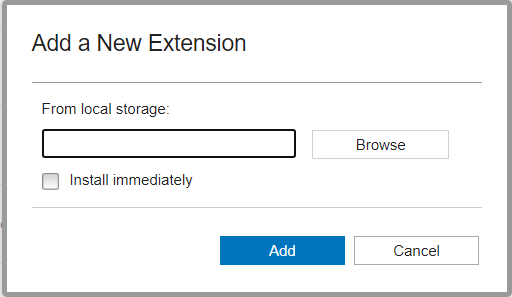
On the Add a New Extension dialog:
-
Browse for the zip file that you downloaded in step 2.
-
Select the Install immediately checkbox.
-
To proceed with the upload, click Add.
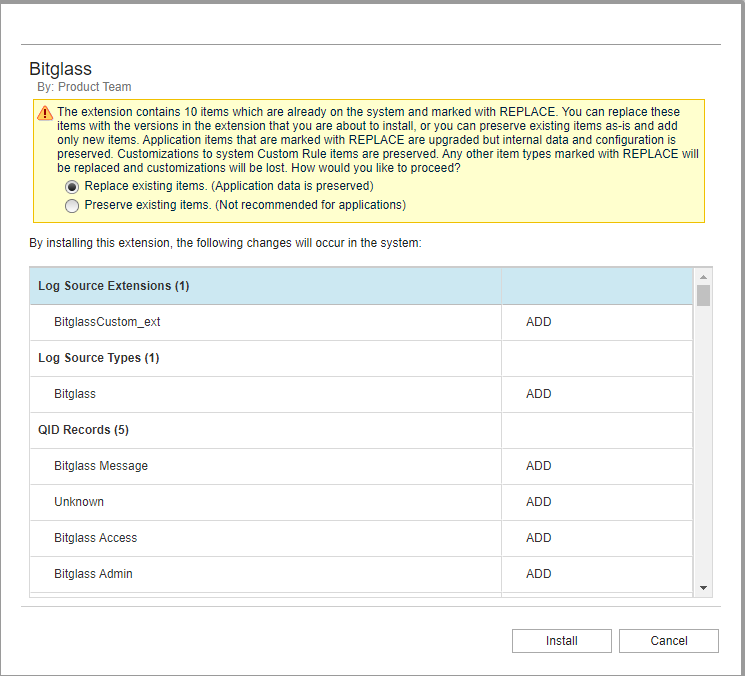
On the next page, you might see a message if you already have items that can be replaced or preserved.
-
Review the table items, select the option that makes sense for your setup and then click Install at the bottom.
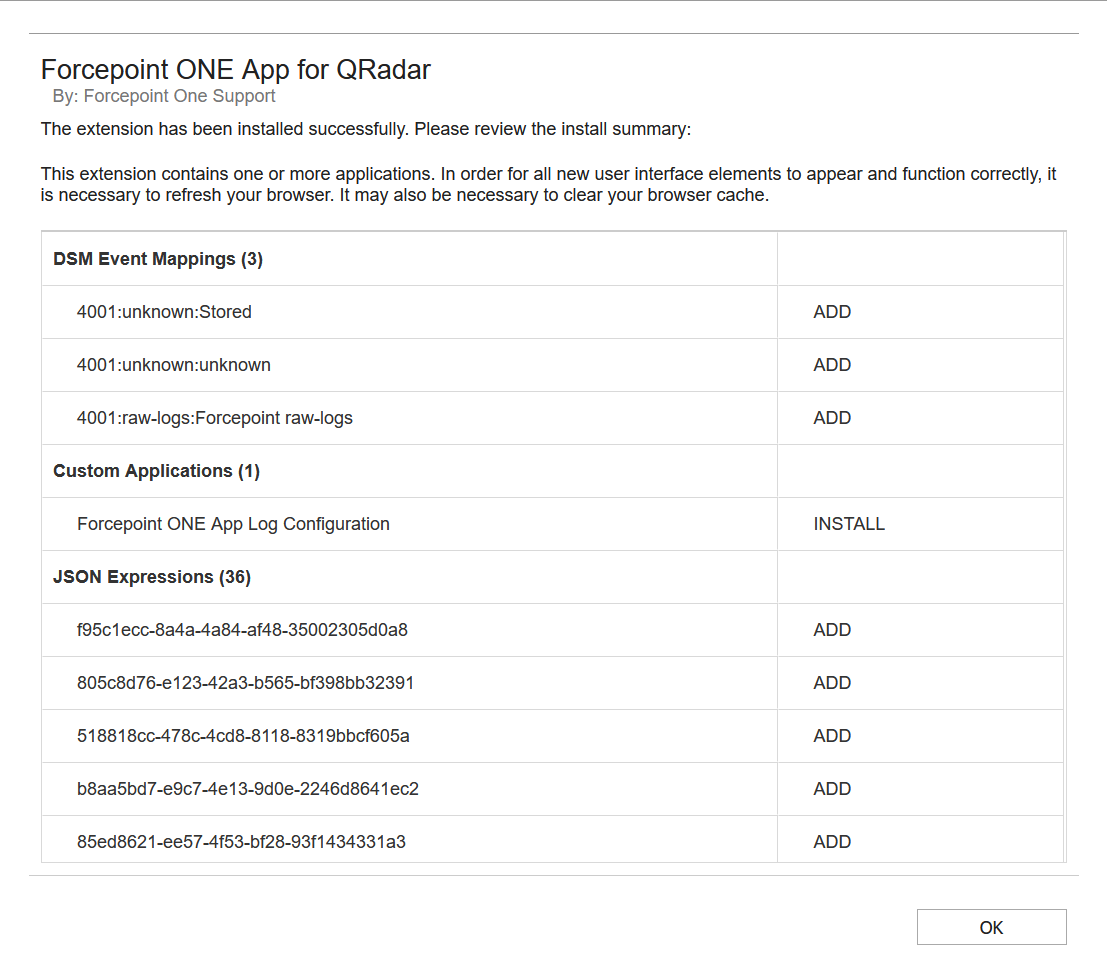
Once installed, you will be redirected to summary dialog where you can review your application setup.
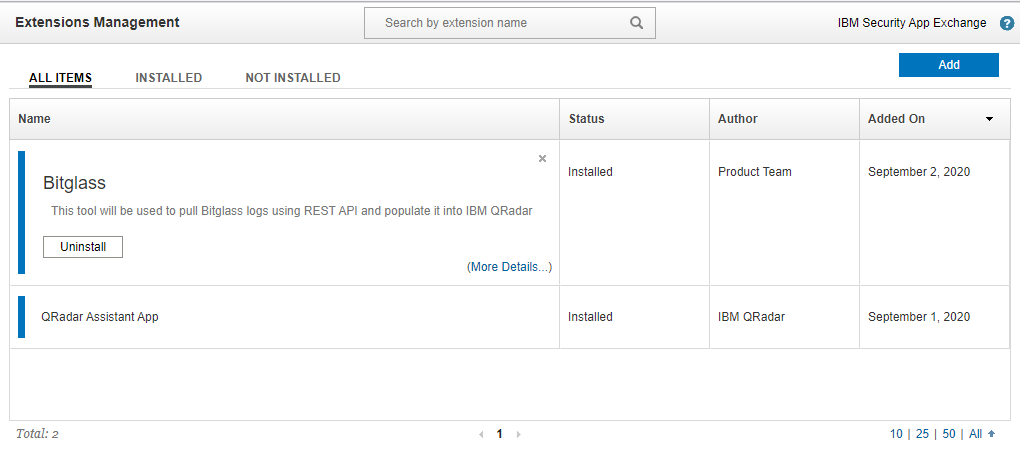
You can also see the Forcepoint ONE App on the Extension Management page.
-
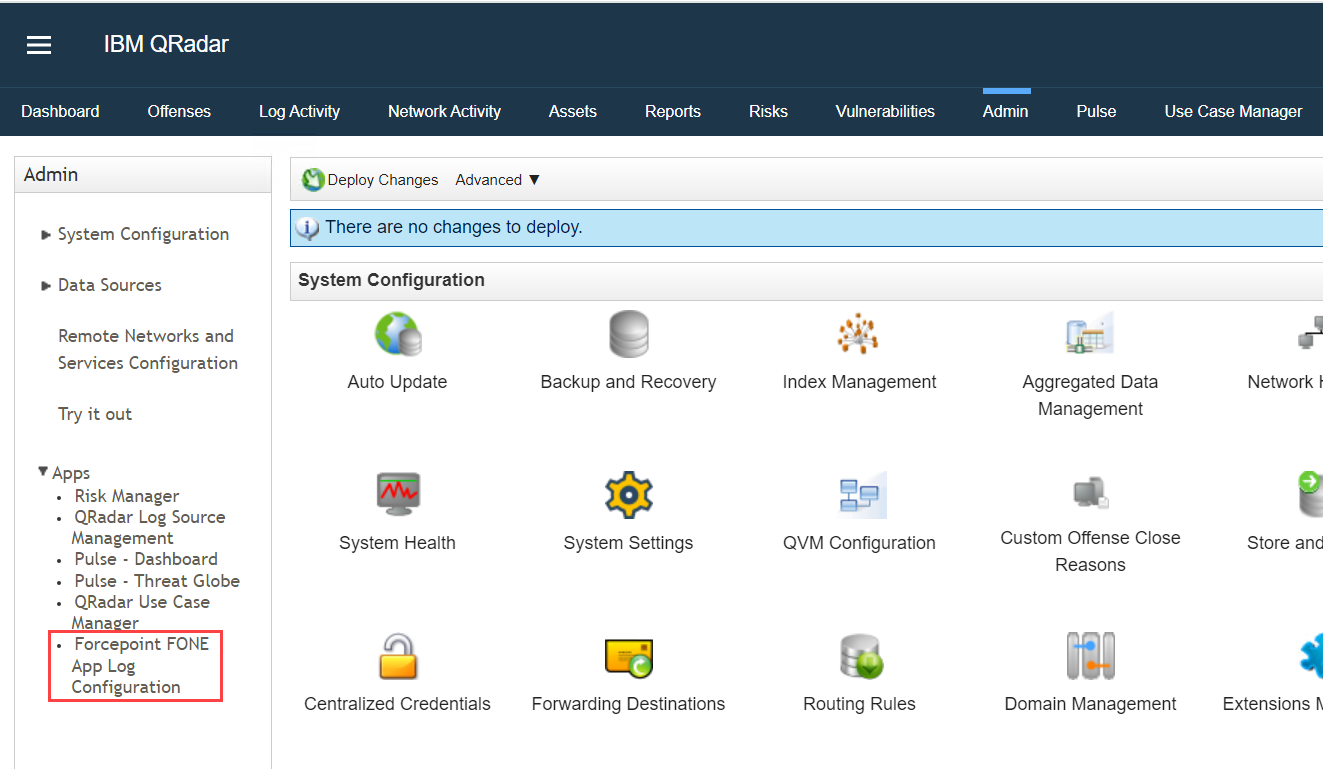
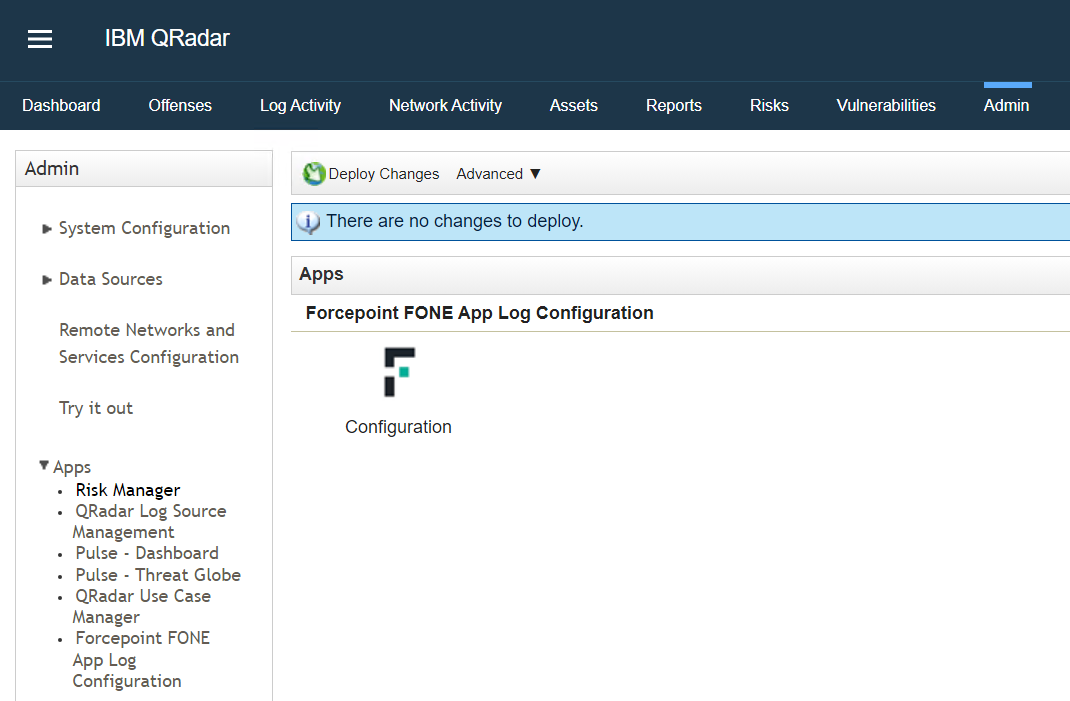
On the Admin page:
-
Expand the Apps drop-down from the left column.
You might need to refresh the page for the Forcepoint ONE App Log Configuration to appear.
-
Select the Forcepoint ONE App Log Configuration and then click on the Configuration option on the right screen.
-
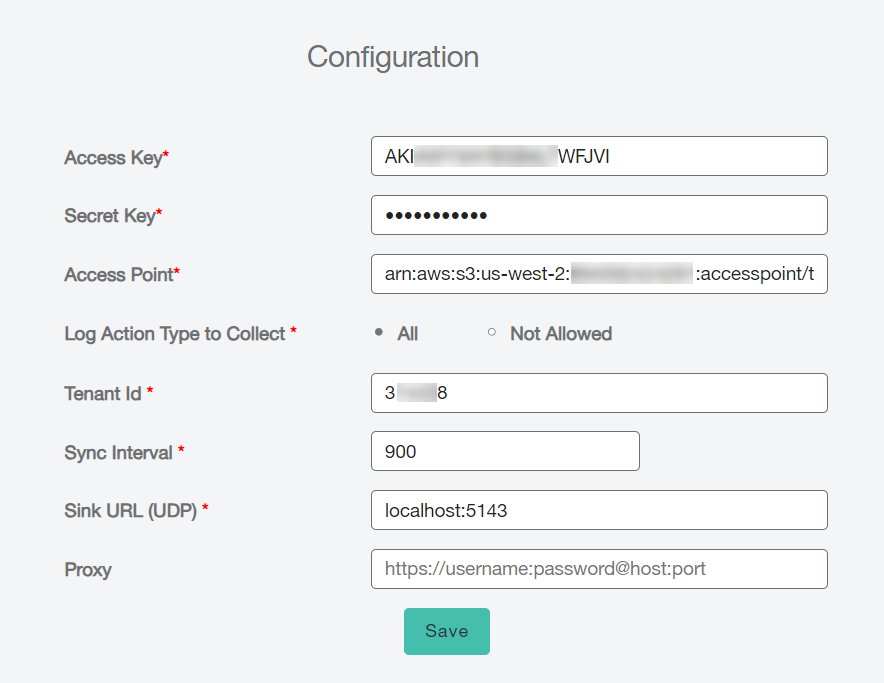
On the Forcepoint ONE App Configuration page:
-
Enter the IAM user's Access Key ID and Secret Access Key of customer's AWS account for which Access Point was created.
-
Copy the Access Point ARN value from the Forcepoint Data Security Cloud | SSE (step 1) and paste in the Access
Point field.
-
Select one of the following options to pull and to display SWG logs in the Web Analysis dashboard:
-
Enter the Forcepoint Data Security Cloud | SSE
Tenant ID.
-
Enter Sync Interval in seconds to define how often the logs should be pulled.
You can only set the values in the range of 600 to 3600 seconds. If you set to lower value, then the sync latency is less when compared to the higher value.
-
Enter the Sink URL (UDP) to direct the logs to the intended destination.
-
Leave the Proxy (optional) field as is unless you are routing your API calls through a proxy at which point you will need to fill out this
field.
-
To save the changes, click Save.
You will see a success message. Give it about 30 minutes for logs to be pulled.
-
To review the pulled logs on QRadar:
-
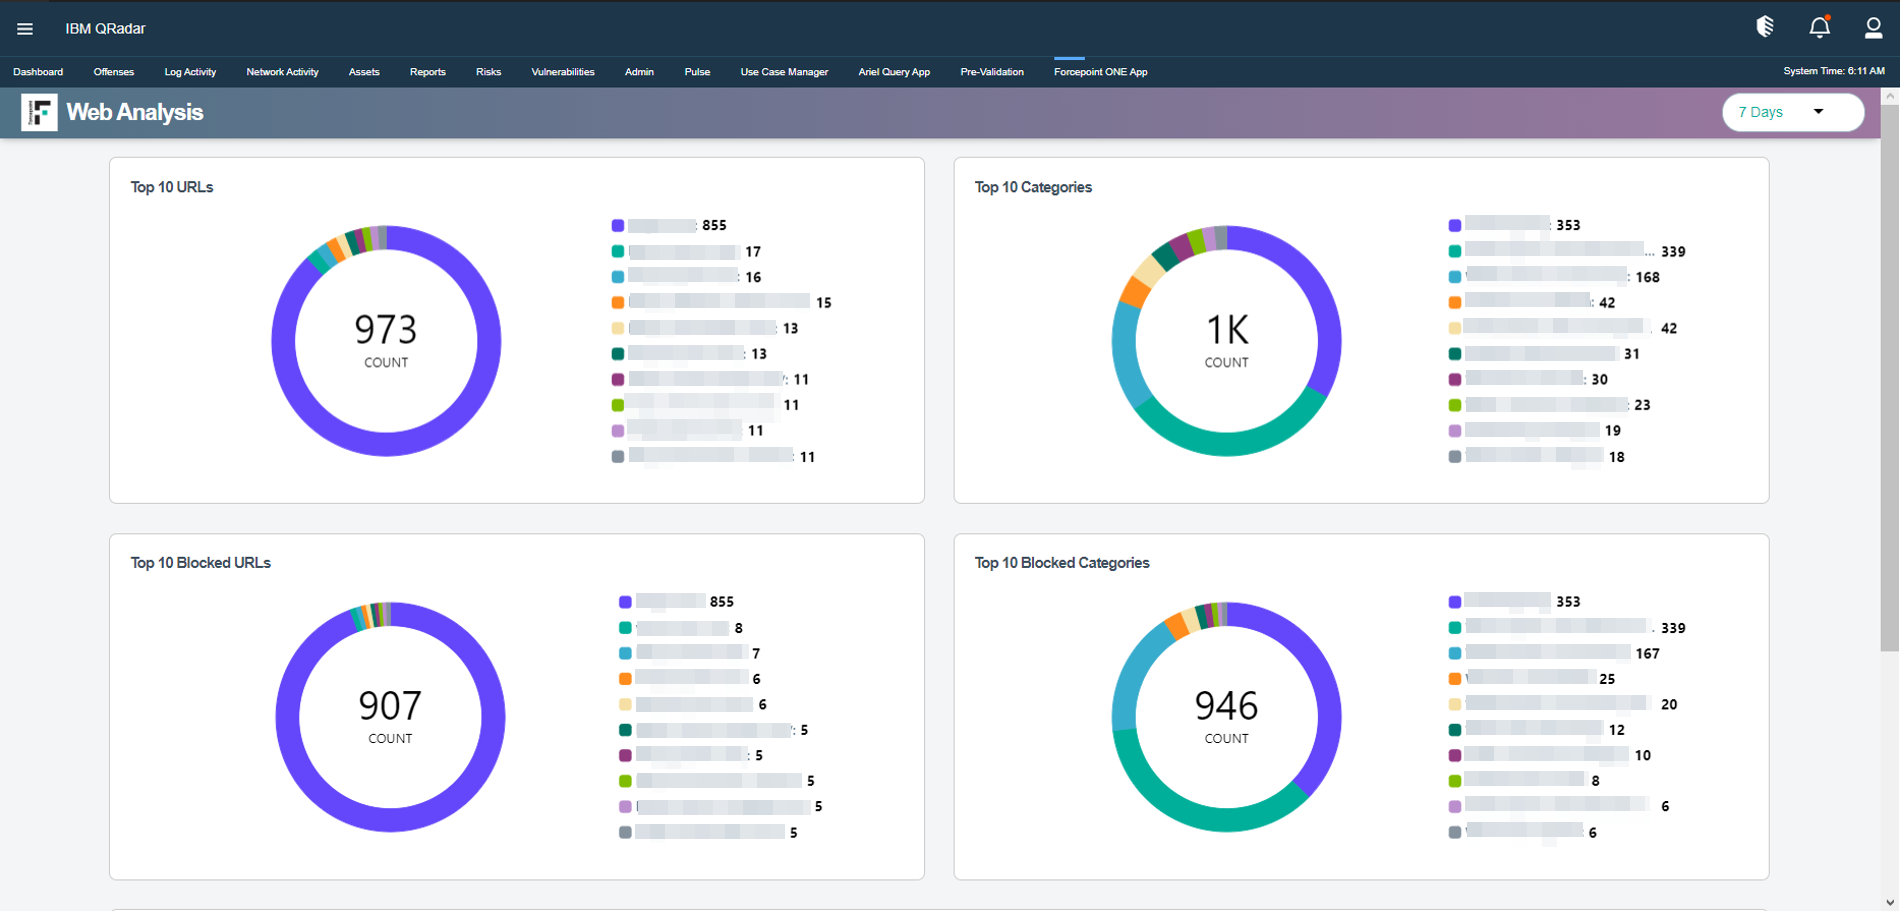
Navigate to your IBM QRadar home page.
There should a new tab named Forcepoint ONE App.
-
Click the Forcepoint ONE App tab to view Web Analysis dashboard.
-
On the upper right-corner of the dashboard, select the duration from the drop-down to view the logs for selected period.
Available options are 15 Minutes, 30 Minutes, 1 Hour, 3 Hours, 6 Hours, 12 Hours, 24 Hours, 3 Days, 7 Days, and 14 Days.
