Reviewing SWG Enterprise Apps dashboard
Forcepoint Data Security Cloud | SSE's SmartEdge agent and Cloud SWG can also generate ShadowIT logs for enterprise applications.
You can access the SWG Enterprise Apps dashboard by navigating to the dashboard.
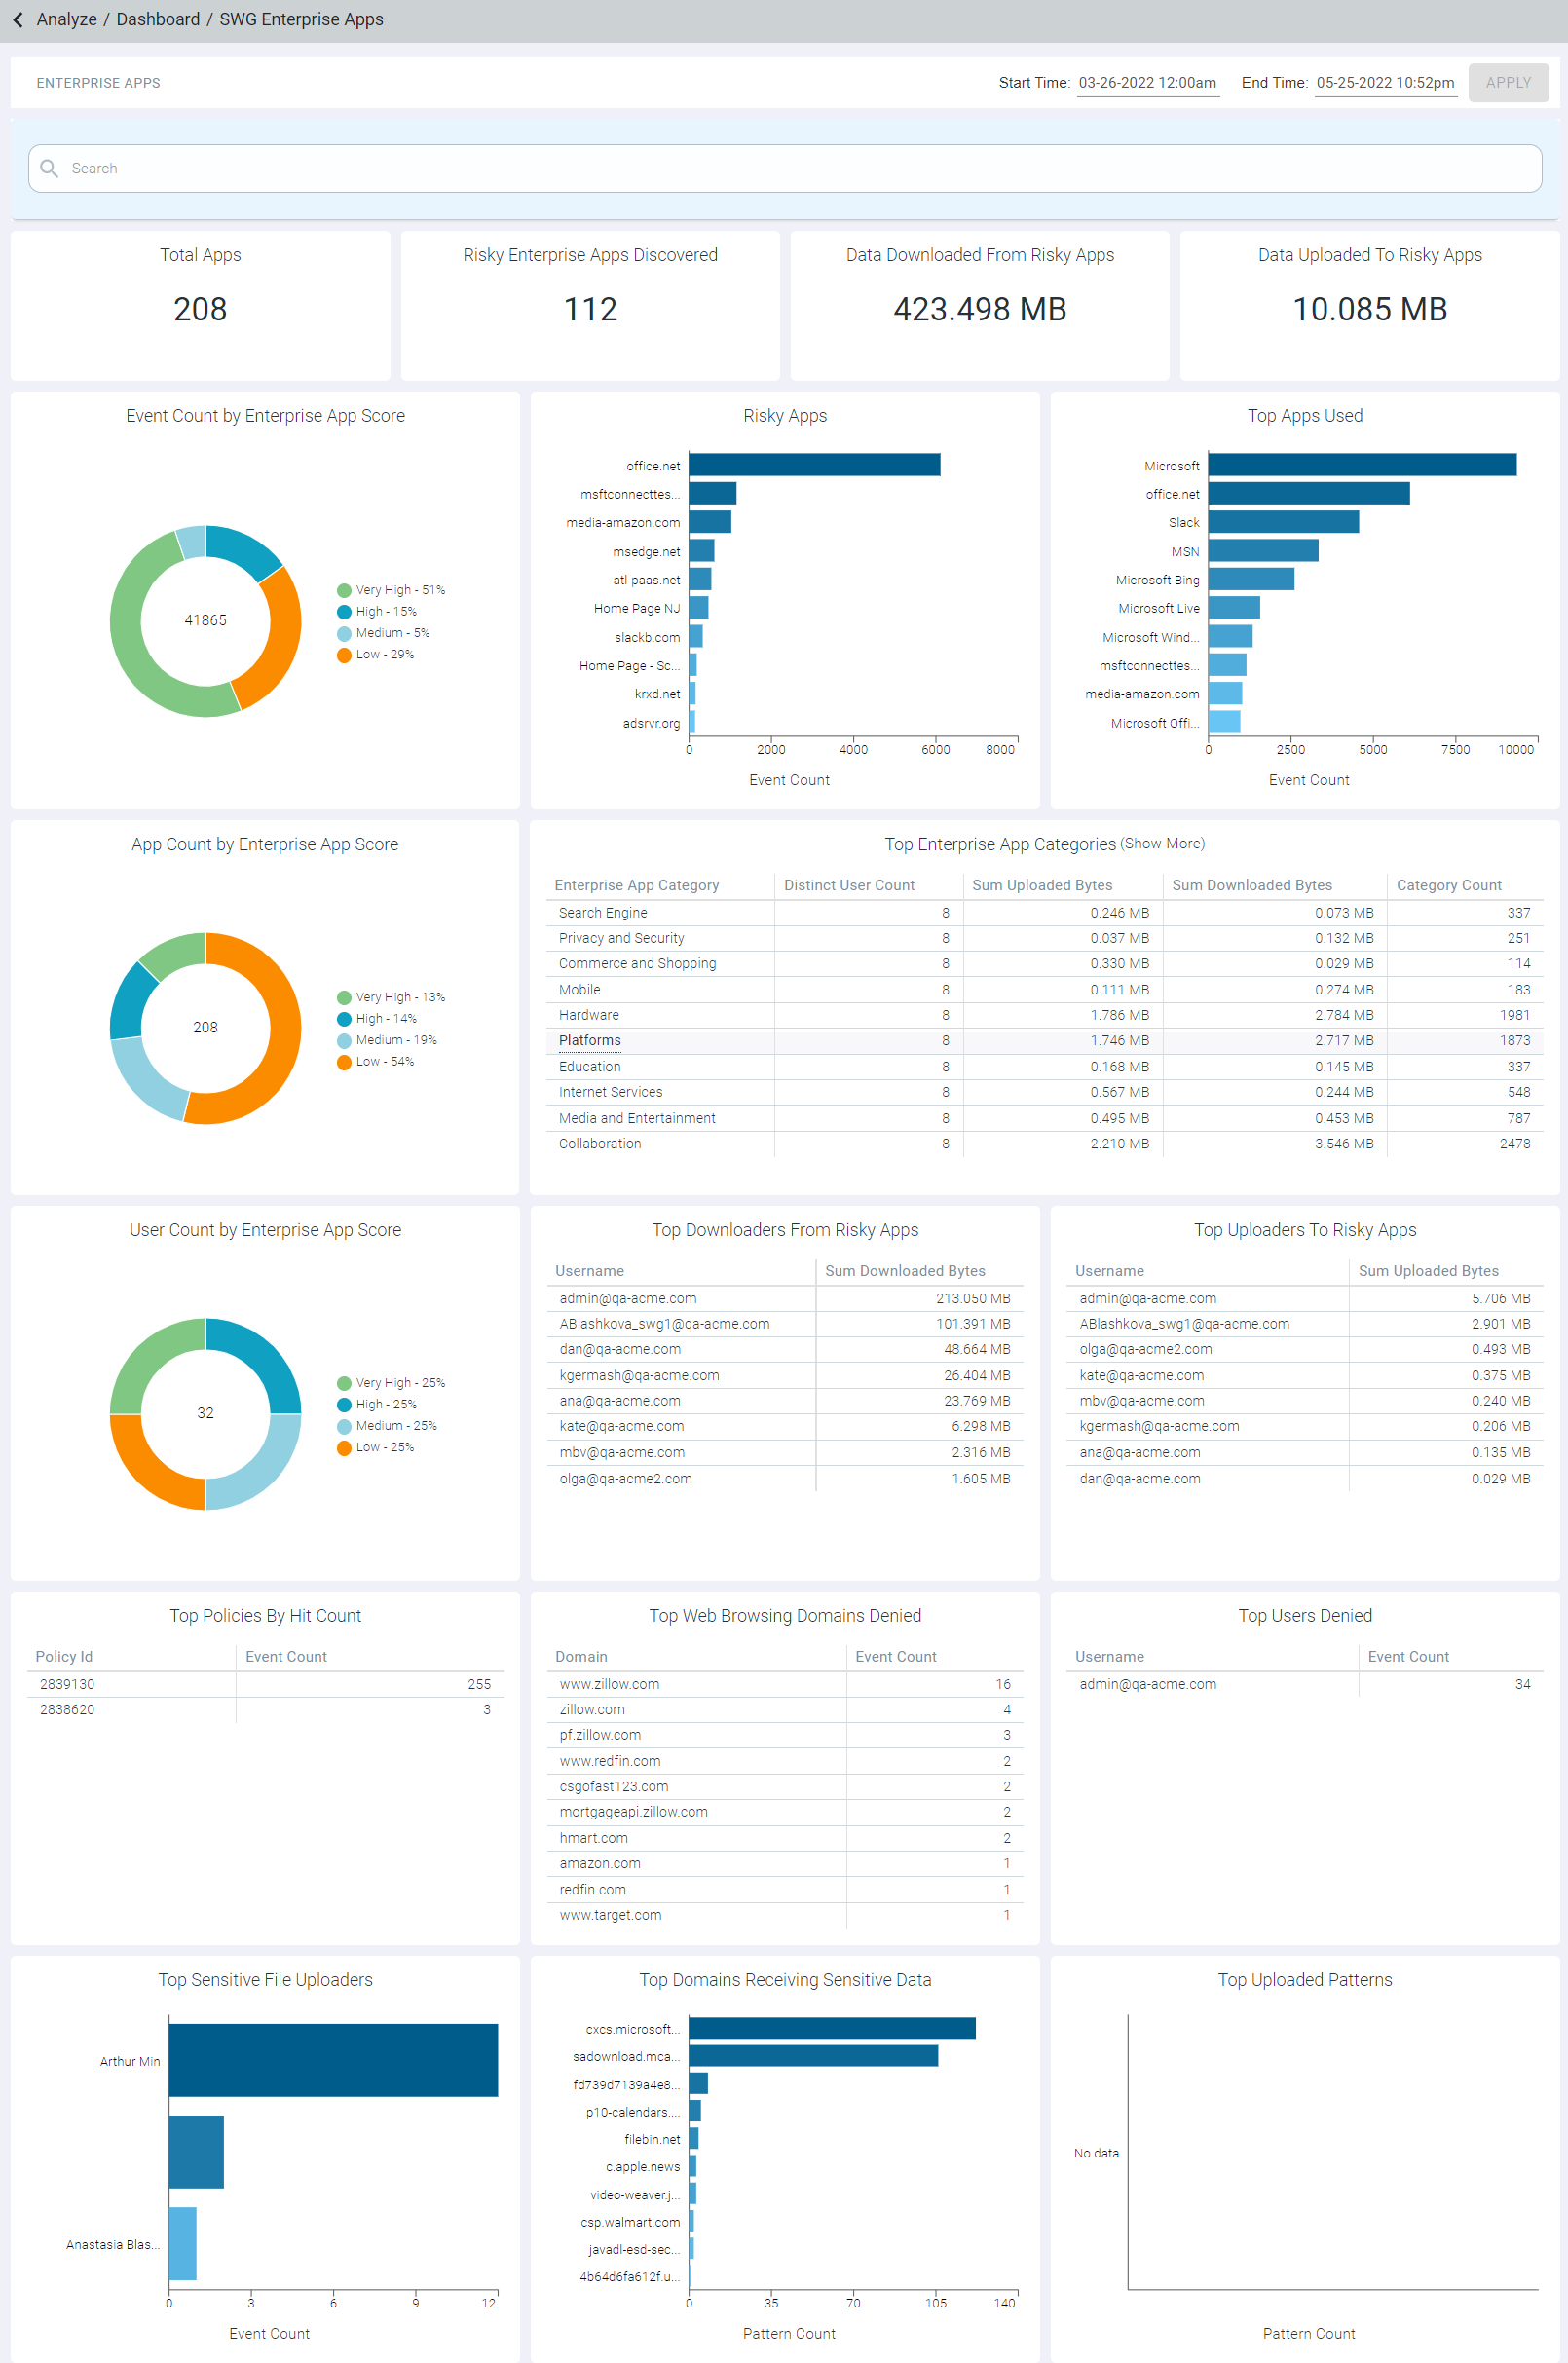
The SWG Enterprise Apps dashboard displays an overview of your user's Web Browsing segmented by the Forcepoint Data Security Cloud | SSE Shadow IT database and Cloud score of individual applications for the selected time range. The dashboard maintains a record of log information for the past 60 days. This dashboard is configured to provide a high-level overview of the top items' admins will want to review. Clicking into the sections will provide the full investigative list with additional details for each application discovered.
URLs, sites or cloud services that have been configured on the policy page to be sent direct for web proxy policies will not appear on this SWG Enterprise Apps dashboard since they have already been accounted for by the policy stating direct access is allowed and approved.
For example, the SWG Enterprise Apps dashboard will not generate logs for all those applications whose reputation is greater than 8 as they have been configured for Direct App Access.

The dashboards display information for last 7 days, by default. You can select the Start Time and End Time and then click Apply to filter the information based on the selected time range. The End Time can be any date prior to today’s date.
Filtering
You can further filter the information by selecting the appropriate filter from the Search drop-down list on top of date range.
Follow the below steps to filter the information:
- Click into the Search box and select the Field option you are filtering by.
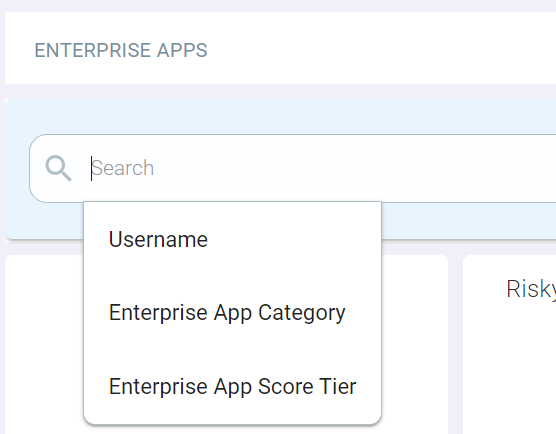
Available options are Username, Enterprise App Category and Web Reputation Tier.
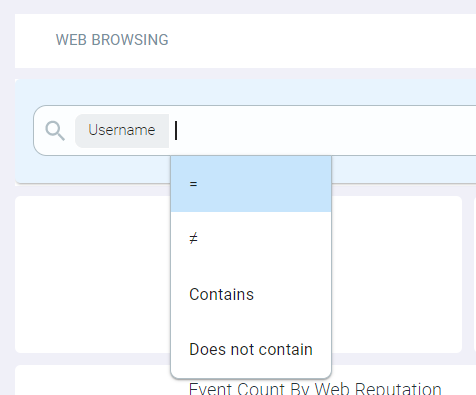
On selecting the field option, Operator drop-down list appears.
- Select the appropriate operator from the drop-down list.
Available options vary as per the field option selected. Available options are equals, does not equal, Contains and Does not contain.
- Enter the text or select the option from the drop-down list to filter the information.
- If you have selected Username or Enterprise App Category from the Field drop-down list, then you should enter text.
- If you have selected Enterprise App Score Tier in the Field drop-down list, then select the applicable value. Available options are Very Low, Low, Medium, High and Very High.
On entering the text or on selecting the option from the drop-down list, AND and OR functions appear.
- Select the AND or OR function to continue your exact match filter.
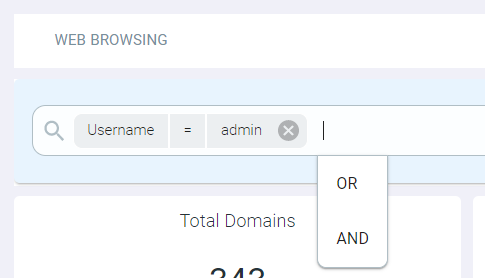
You can then continue to add refined filters as desired. Once ready to search, click into the space with the magnifying glass to search.
Total Apps
The Total Apps widget indicates the total number of applications accessed by the users.
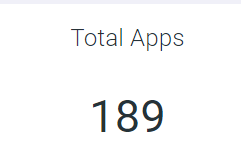
You can click the number to open Total Apps page displaying the App Name, Distinct User Count, Sum Uploaded Bytes, Sum Downloaded Bytes, Event Count and Enterprise App Score details of apps accessed by the users.
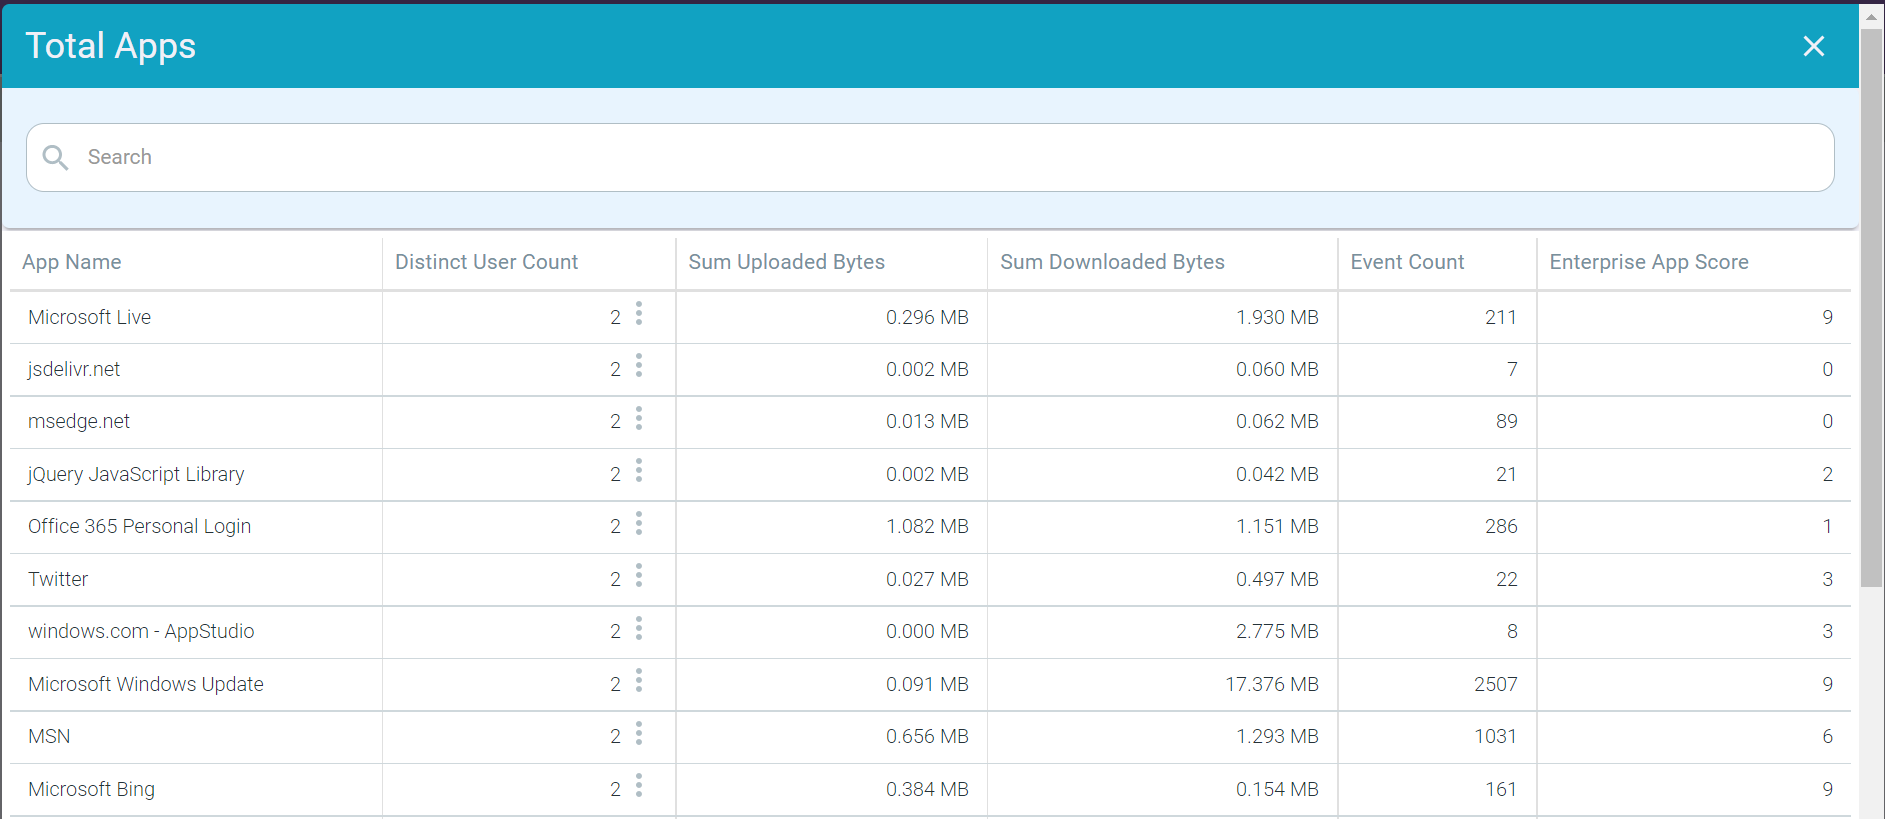
You can further drilldown the details based on distinct users by clicking on the ellipsis icon ![]() next to the Distinct User Count number for that App and then clicking the Drilldown into user count option.
The Total Apps: <App Name> page opens displaying the User Email, Sum Uploaded Bytes, Sum Downloaded Bytes and Event Count details of the users who accessed the
domain.
next to the Distinct User Count number for that App and then clicking the Drilldown into user count option.
The Total Apps: <App Name> page opens displaying the User Email, Sum Uploaded Bytes, Sum Downloaded Bytes and Event Count details of the users who accessed the
domain.

Click the close icon to close the Total Apps: <App Name> page and to go back to the SWG Enterprise Apps.
Risky Enterprise Apps Discovered
The Risky Enterprise Apps Discovered widget indicates the number of risky enterprise applications, that is Apps with Enterprise App Score Tier equal to Suspicious (2-3) or High Risk (0-1), accessed by the users.
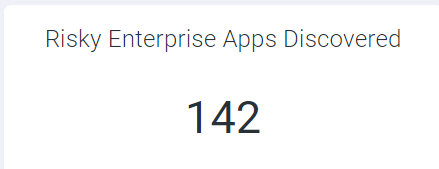
When you click the number, the Risky Apps Discovered page opens displaying the risky App Name, Distinct User Count, Sum Uploaded Bytes, Sum Downloaded Bytes, Event Count and Enterprise App Score details of apps accessed by the users.
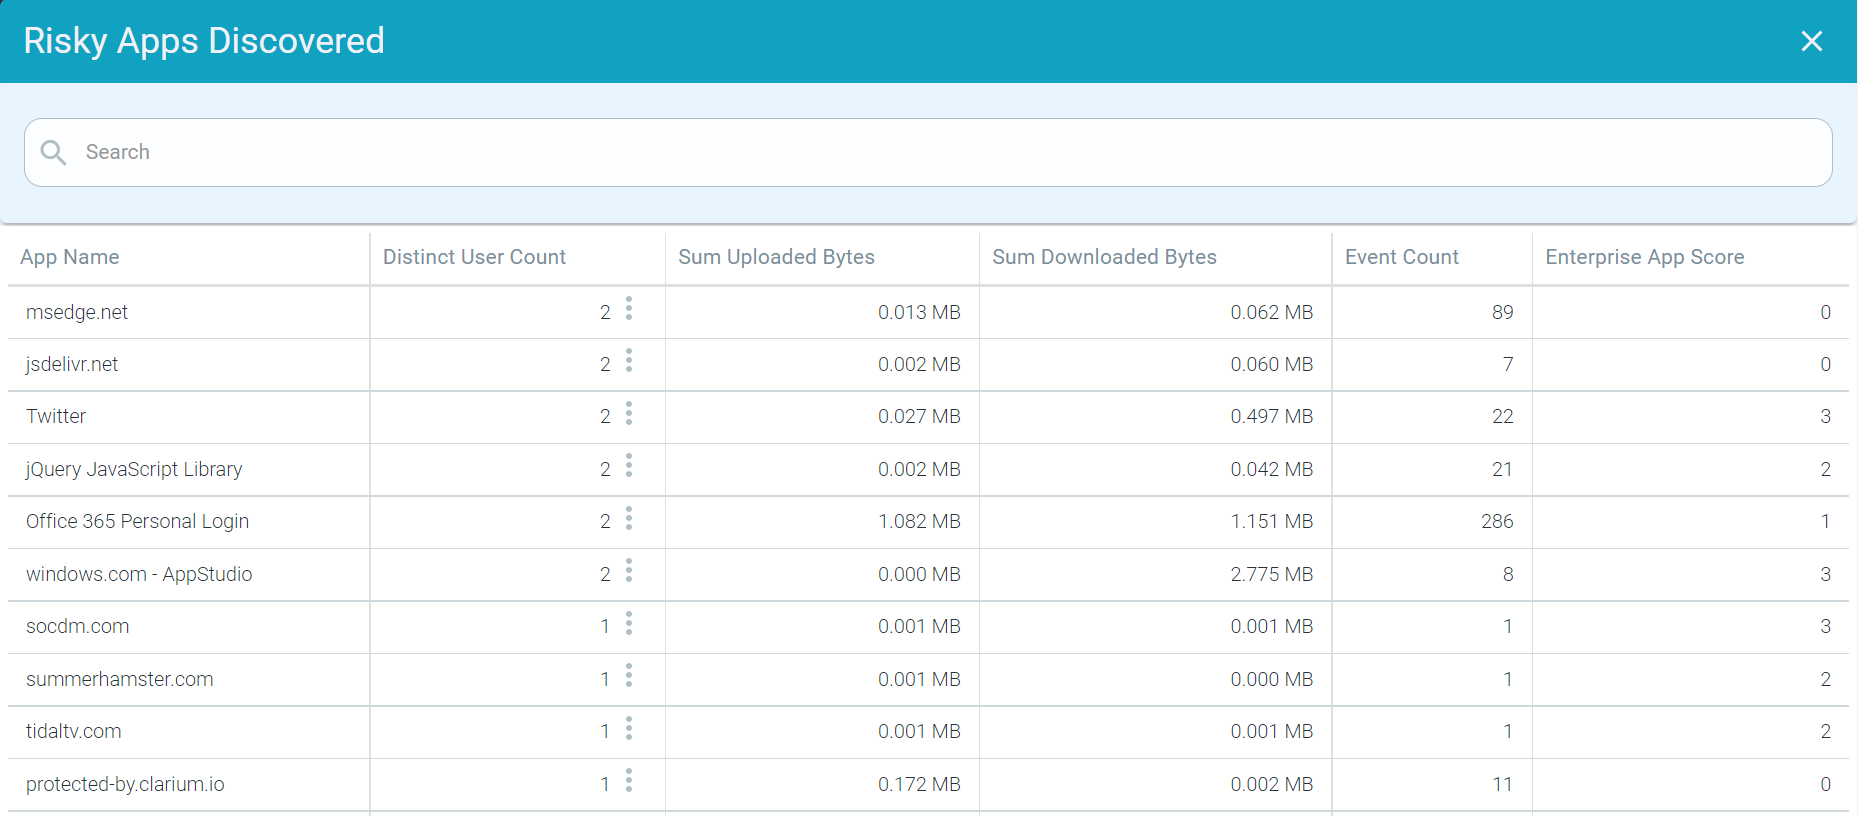
You can further drilldown the details based on distinct users by clicking on the ellipsis icon ![]() next to the Distinct User Count number for that app and then clicking the Drilldown into user count option.
The Risky Apps: <App Name> page opens displaying the User Email, Event Count, Sum Uploaded Bytes, and Sum Downloaded Bytes details of the users who accessed the
application.
next to the Distinct User Count number for that app and then clicking the Drilldown into user count option.
The Risky Apps: <App Name> page opens displaying the User Email, Event Count, Sum Uploaded Bytes, and Sum Downloaded Bytes details of the users who accessed the
application.

Click the close icon to close the Risky Apps: <App Name> page and to go back to the SWG Enterprise Apps page.
Data Downloaded From Risky Apps
The Data Downloaded from Risky Apps widget indicates the volume of downloads from risky apps in megabytes (MB), that is apps with Enterprise App Score equal to Suspicious (2-3) or High Risk (0-1).
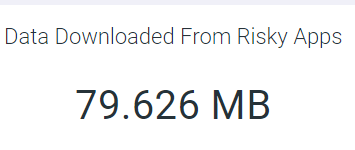
When you click the number, the Data Downloaded from Risky Apps page opens displaying the App Name, User Full Name, Sum Downloaded Bytes and Enterprise App Score details.

Click the close icon to close the Data Downloaded from Risky Apps page and to go back to the SWG Enterprise Apps page.
Data Uploaded To Risky Apps
The Data Uploaded To Risky Destinations widget indicates the volume of uploads to risky apps in megabytes (MB), that is apps with Enterprise App Score equal to Suspicious (2-3) or High Risk (0-1).
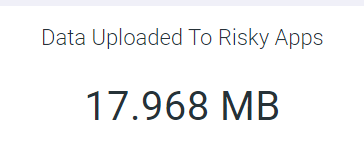
When you click the number, the Data Uploaded to Risky Apps page opens displaying the App Name, User Full Name, Sum Uploaded Bytes and Enterprise App Score details.

Click the close icon to close the Data Uploaded to Risky Apps page and to go back to the SWG Enterprise Apps page.
Event Count by Enterprise App Score, App Count by Enterprise App Score and User Count by Enterprise App Score
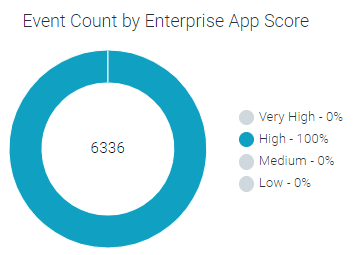
The Event Count by Enterprise App Score widget displays the event count across all the Enterprise App Score Tiers, the App Count by Enterprise App Score widget displays the apps count across all Enterprise App Score Tiers and the User Count by Enterprise App Score widget displays the user count across all Enterprise App Score Tiers. For example, the Event Count by Enterprise App Score widget is explained. You can follow the same process for the App Count By Enterprise App Score and the User Count By Enterprise App Score widgets.
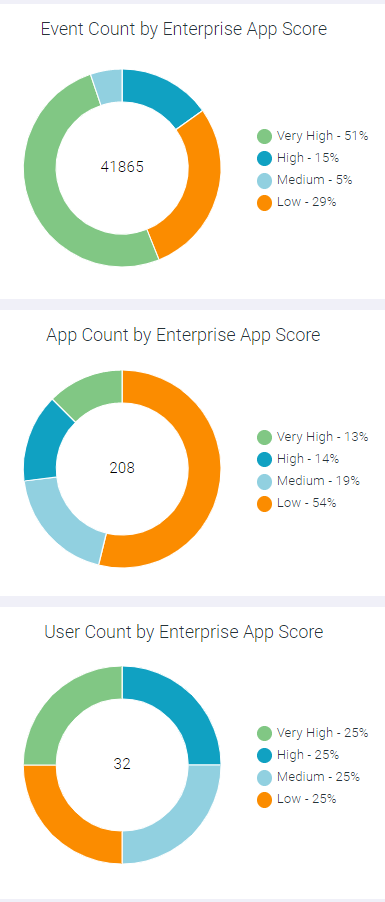
When you place the mouse pointer on enterprise app score tier of the pie chart, it displays the total count for the pointed enterprise app score tier and name of the enterprise app score tier.
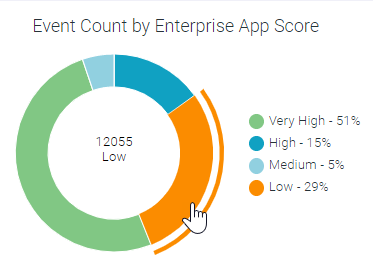
You can click into the donut chart on a specific ranking color and click Drill into <enterprise app score tier> to pull up a new window with the list of details for that particular app score tier. For example, clicking the very low piece of the Event Count by Enterprise App Score chart will bring up a detail window containing the list of applications with very low app score.
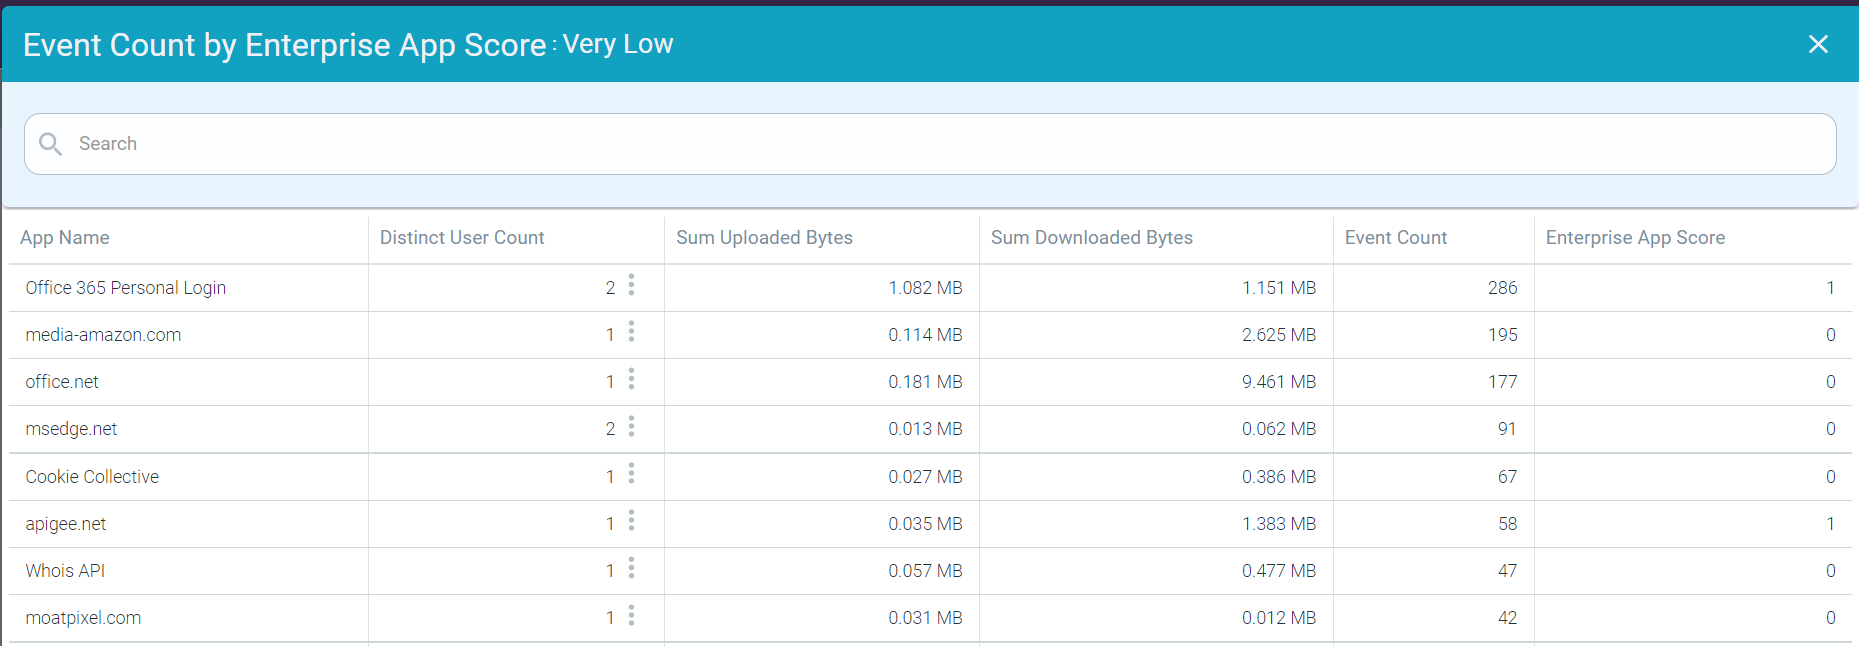
You can further drilldown the details based on distinct users by clicking on the ellipsis icon ![]() next to the Distinct User Count number for that App and then clicking the Drilldown into user count option.
The Event Count By Enterprise App Score : <App> page opens displaying the User Email, Sum Uploaded Bytes, and Sum Downloaded Bytes details of the users who
accessed the destination.
next to the Distinct User Count number for that App and then clicking the Drilldown into user count option.
The Event Count By Enterprise App Score : <App> page opens displaying the User Email, Sum Uploaded Bytes, and Sum Downloaded Bytes details of the users who
accessed the destination.

Click the close icon to close the Event Count By Enterprise App Score : <App> page and to go back to the SWG Enterprise Apps page.
You can also turn off pieces of the donut chart by clicking the bulleted enterprise app score tier on the side to hide the data related to selected app score tier.
Risky Apps and Top Apps Used
The Risky Apps widget displays top 10 risky apps based on the user count and the Top Apps Used widget displays top 10 apps based on the user count.
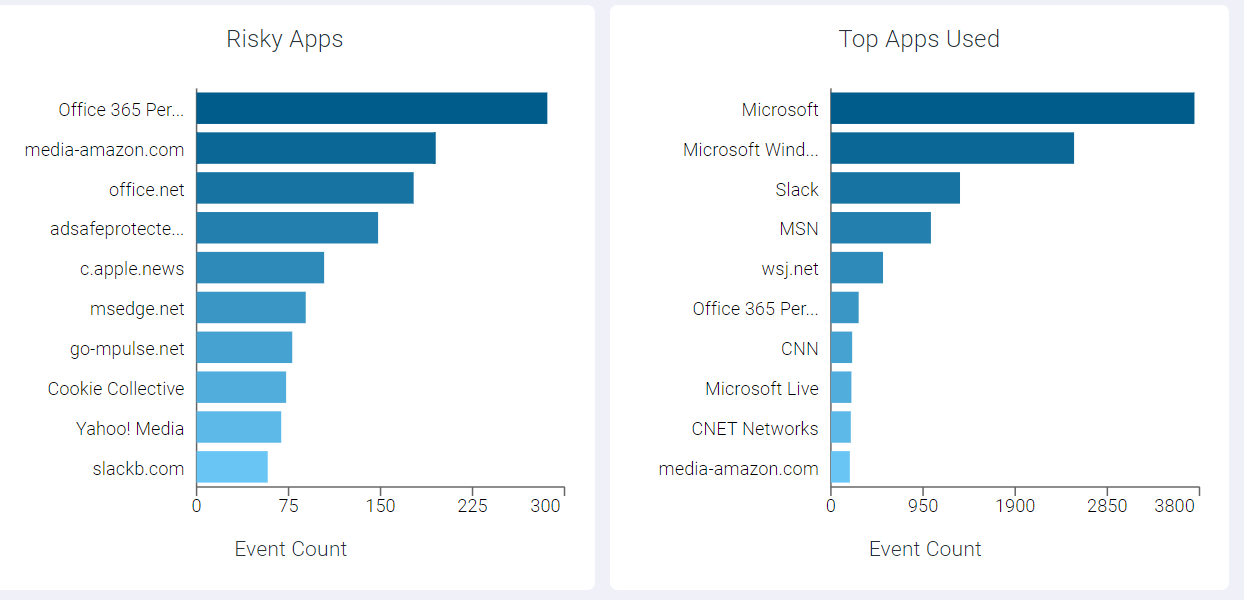
You can click on any of the app name and click Drill into <App Name> option to further investigate the app. A page opens displaying various users who used the app, total volume of data uploaded and downloaded from/to app and number of times app was used.

Top Enterprise App Categories
The Top Enterprise App Categories widget displays top 10 categories by user count. You can click See All to view all the enterprise app categories.
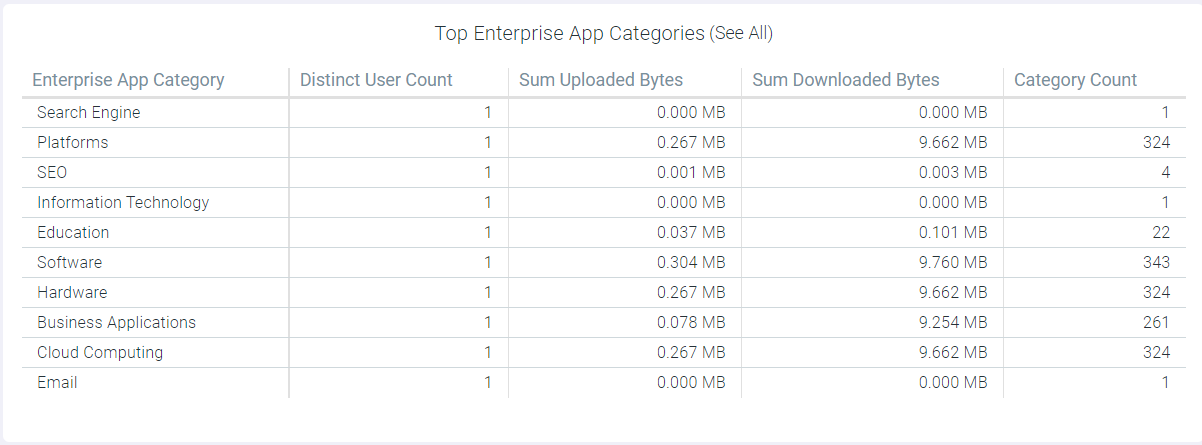
You can filter the top enterprise app categories by clicking the particular enterprise app category. On clicking the category, the Top Enterprise App Categories: <App Category Name> page opens displaying App Name, Distinct User Count, Sum Uploaded Bytes, Sum Downloaded Bytes, Category Count and Enterprise App Score details for that category.
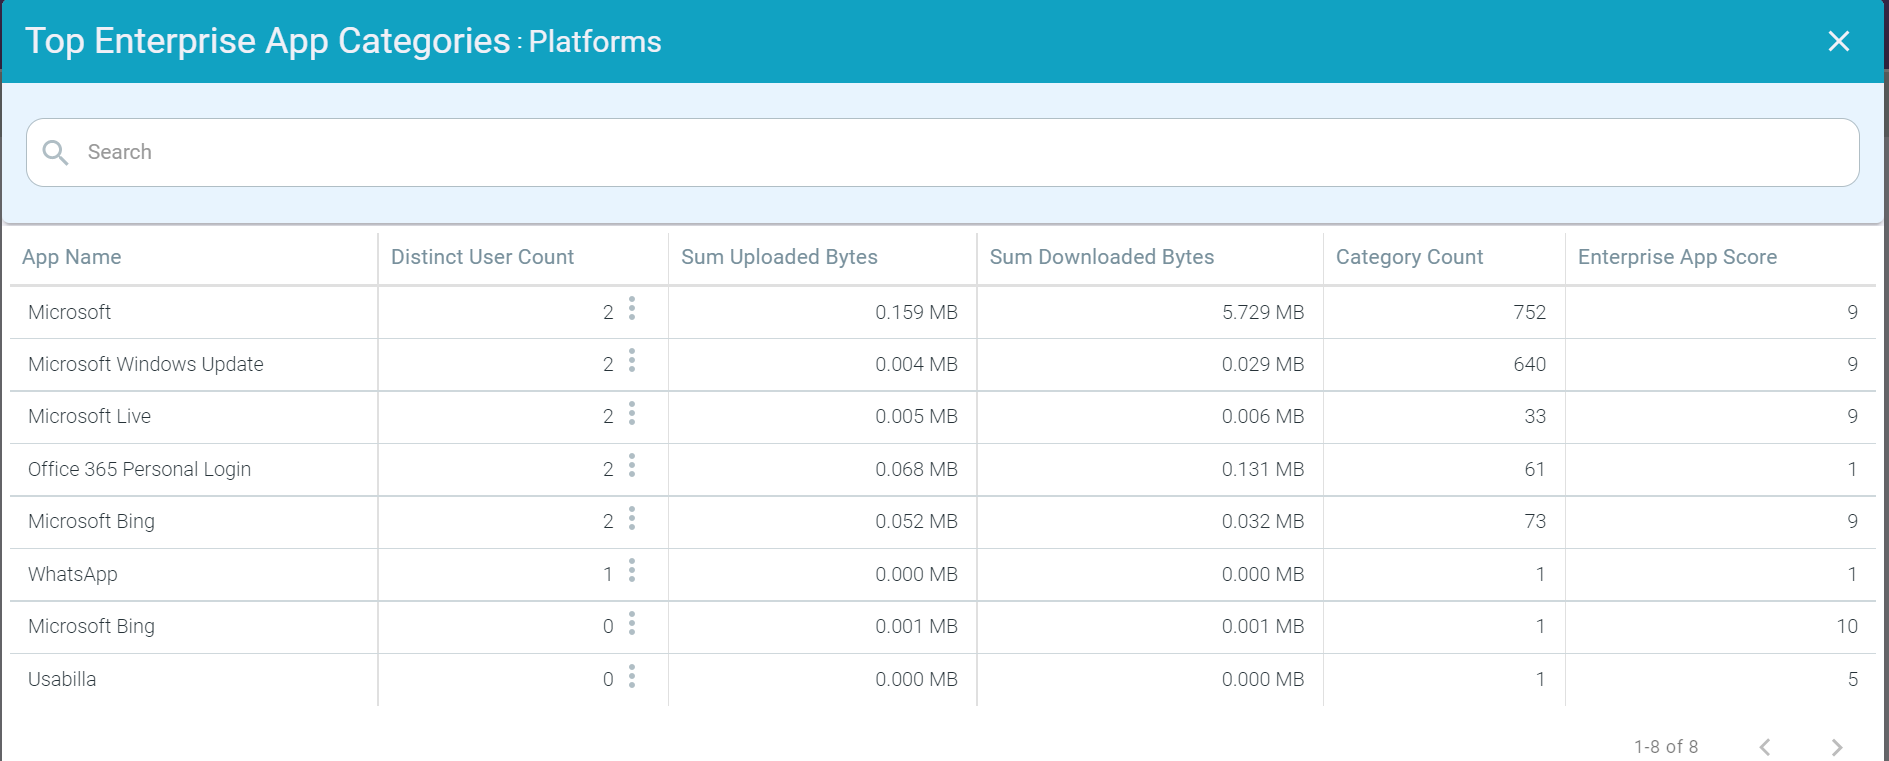
You can further drilldown the details based on distinct users by clicking on the ellipsis icon ![]() next to the Distinct User Count number for that destination and then clicking the Drilldown into user count
option. The Top Enterprise App Categories: <App Name> page opens displaying the User Email, Category Count, Sum Uploaded Bytes, and Sum Downloaded Bytes details
of the users who accessed the application.
next to the Distinct User Count number for that destination and then clicking the Drilldown into user count
option. The Top Enterprise App Categories: <App Name> page opens displaying the User Email, Category Count, Sum Uploaded Bytes, and Sum Downloaded Bytes details
of the users who accessed the application.

Click the close icon to close the Top Enterprise App Categories: <App Name> page and to go back to the SWG Enterprise Apps page.
Top Uploaders To Risky Apps and Top Downloaders From Risky Apps
The Top Uploaders To Risky Apps and Top Downloaders From Risky Apps widgets display top uploaders and downloaders to and from risky applications. These widgets display only applications whose Enterprise App Score Tier is Suspicious (2-3) or High Risk (0-1).

You can drilldown into the top uploaders or downloaders by clicking the User Email.
On clicking the User Email, the Top Uploaders To Risky Apps: <User Email> page opens displaying User Email, Source IP, Enterprise App Score and Sum Upload Bytes details for that user.

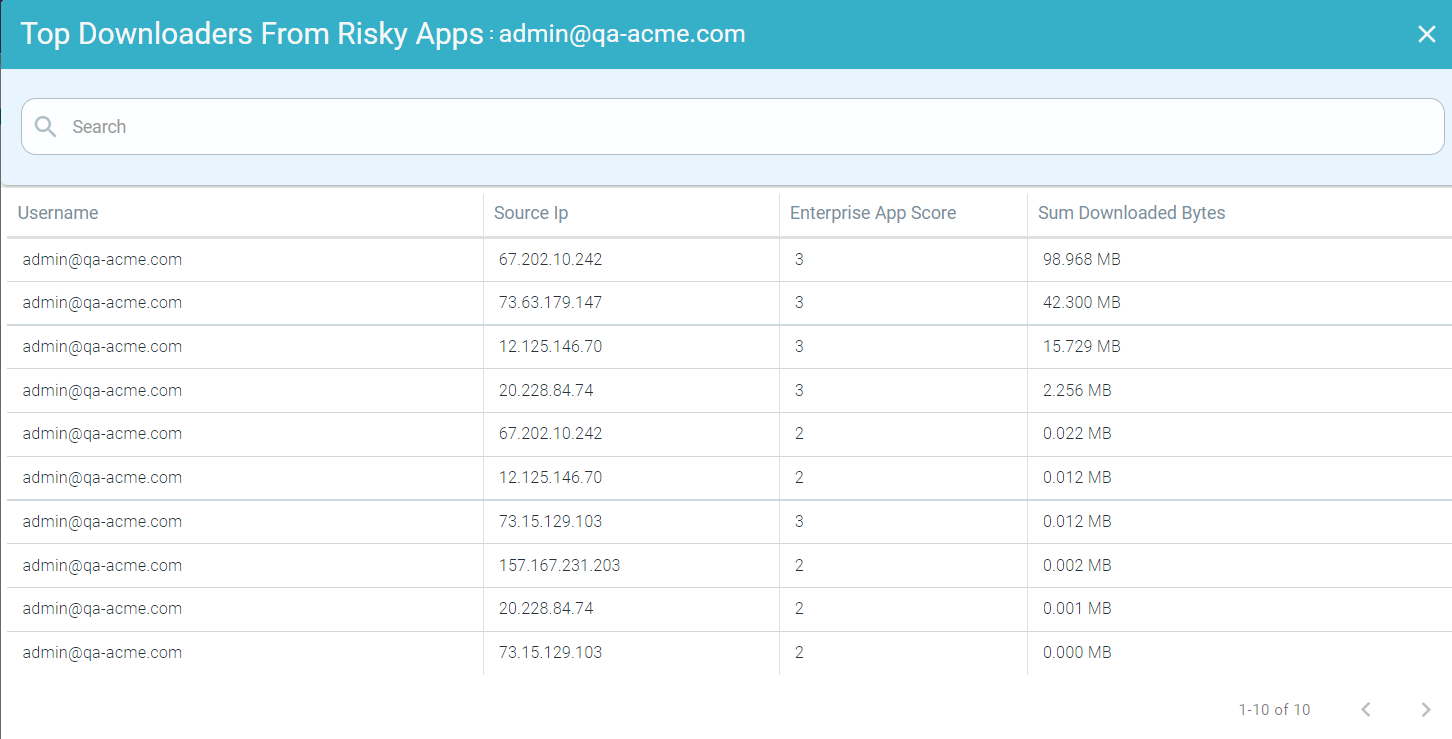
Click the close icon to close the Top Uploaders To Risky Apps: <User Email> or Top Downloaders from Risky Apps: <User Email> page and to go back to the SWG Enterprise Apps page.
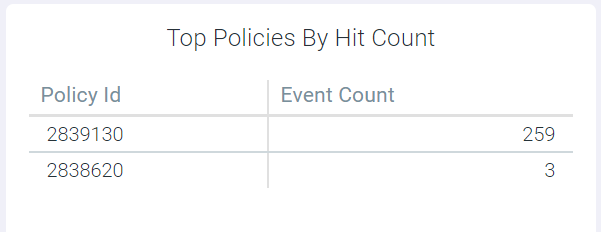
Top Policies By Hit Count
The Top Policies By Hit Count widget displays the top 10 policies by hit count.
Top Users Denied

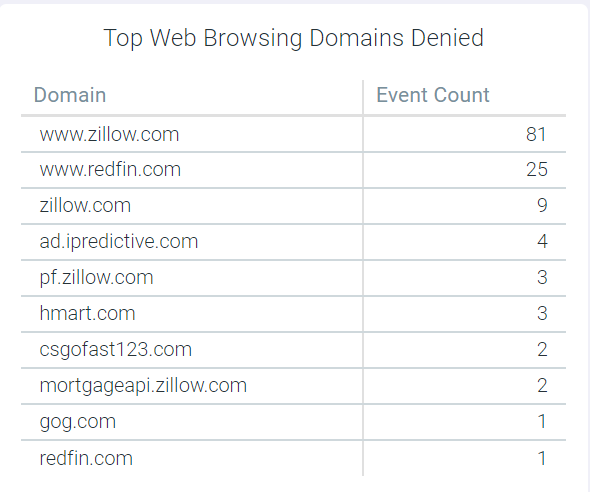
Top Web Browsing Domains Denied
Top Sensitive File Uploaders, Top Domains Receiving Sensitive Data and Top Uploaded Patterns
The Top Sensitive File Uploaders, Top Domains Receiving Sensitive Data and Top Uploaded Patterns widgets display the top offenders who uploaded sensitive data, top domains where sensitive data was uploaded and which data patterns were identified the most during upload.

You can drilldown the Top Domains Receiving Sensitive Data widget to more granular level to analyze the data.