Log Export Splunk App
Forcepoint Insights provides a Splunk app on splunkbase for easily integrating with Forcepoint Data Cloud Insight's Export API for pulling Forcepoint Data Security Cloud logs across multiple licensed Products.
action log is not equal to 'Allowed' are pulled. Prerequisites
- Tenant must be registered on the platform and have access to the tenant portal.
- Tenant must have an API Key generated on the Platform UI.
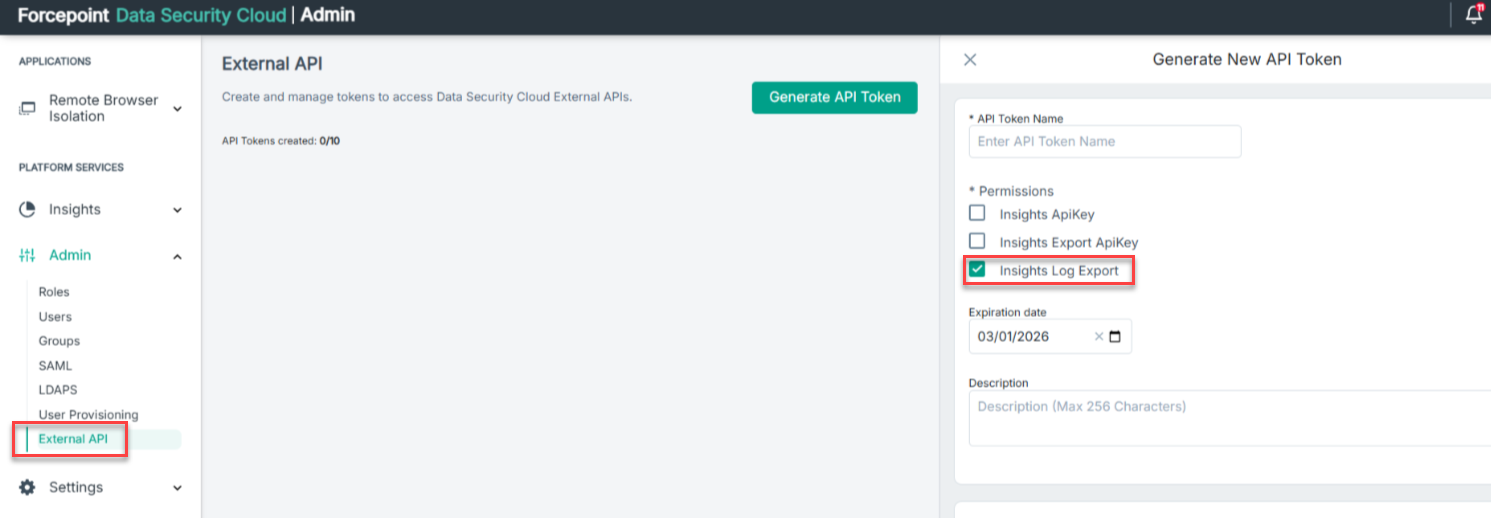
For more details refer to this link
Steps to pull logs to your Splunk Instances
- On a new browser tab or window, login to your Splunk instance.
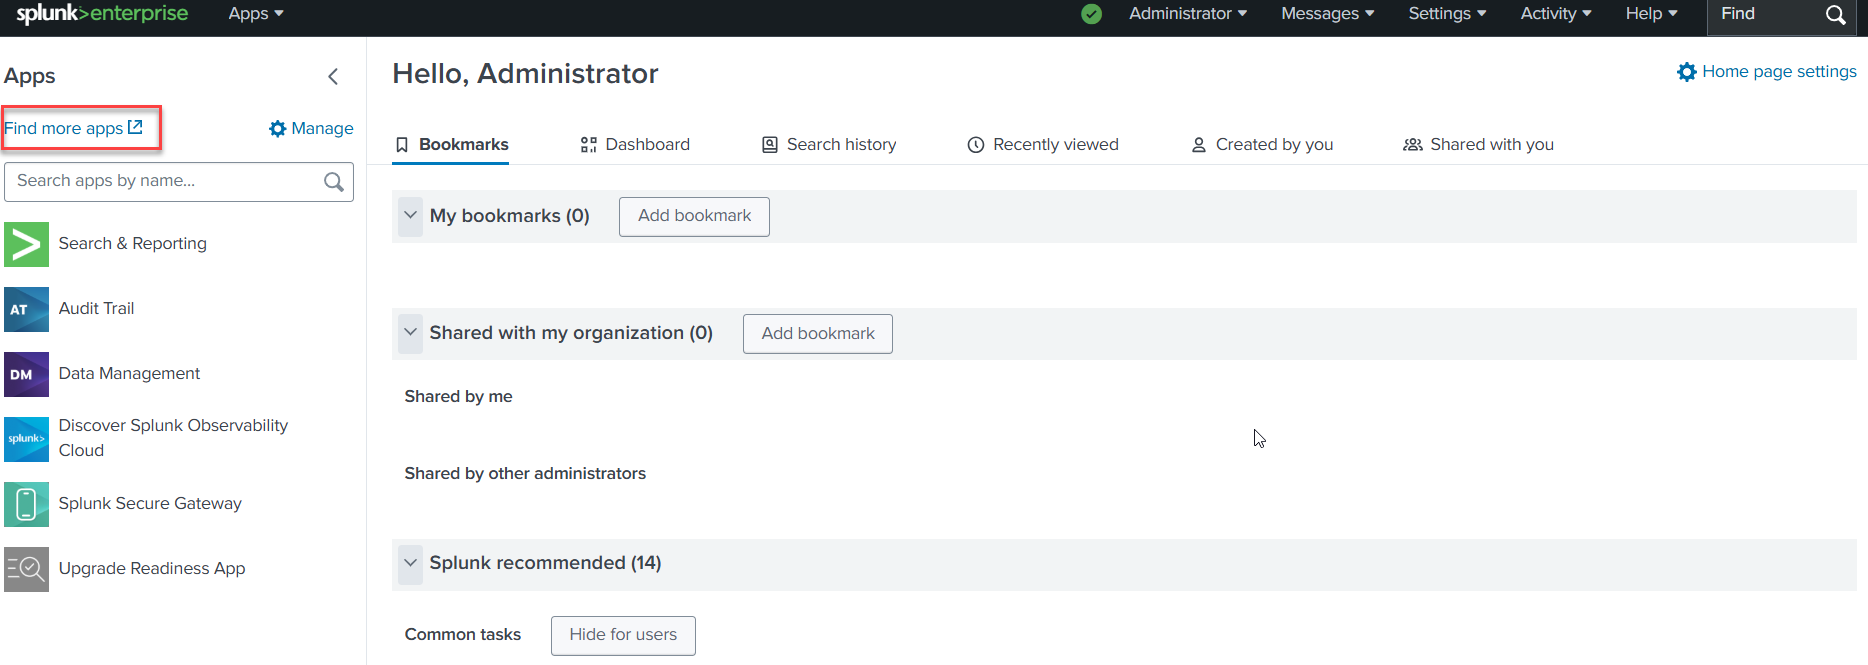
- On the Splunk homepage, click Find More Apps from the left column and search for Forcepoint Insights SIEM App.
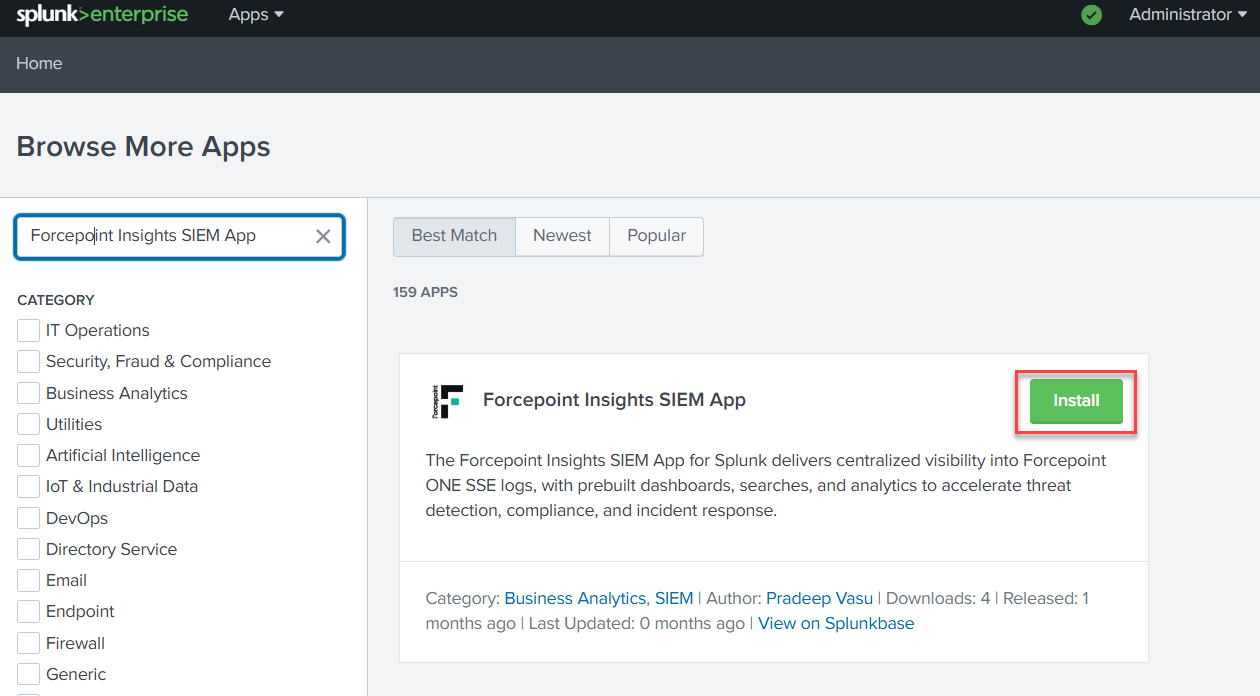
- From the search results, click Install on the Forcepoint Insights SIEM App.
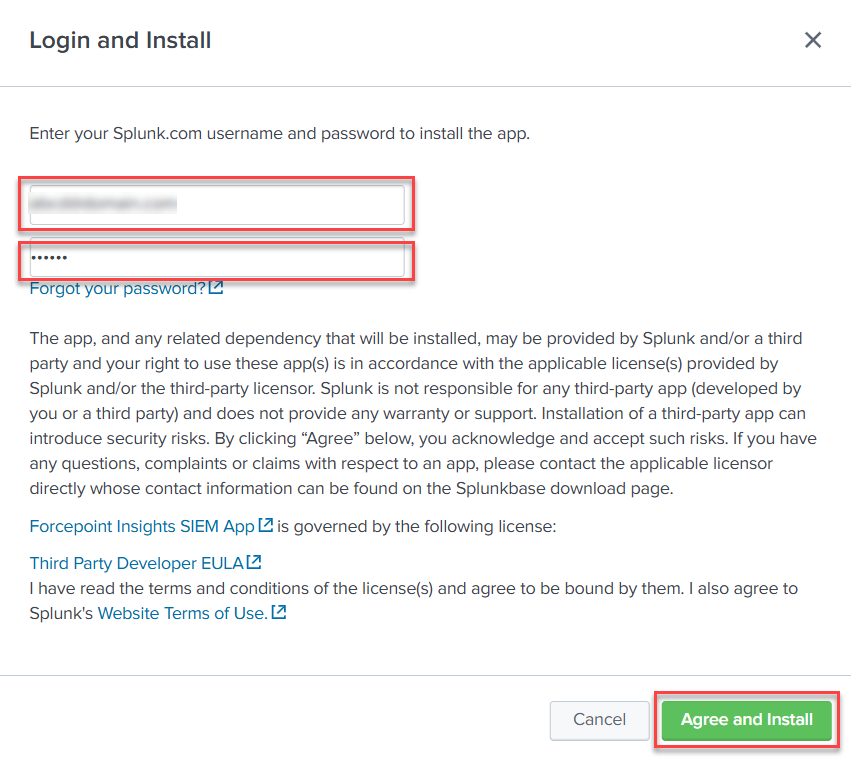
- On the Login and Install dialog:
- Enter your Splunk account login credentials and click Agree and Install. It will require you to restart your Splunk instance.
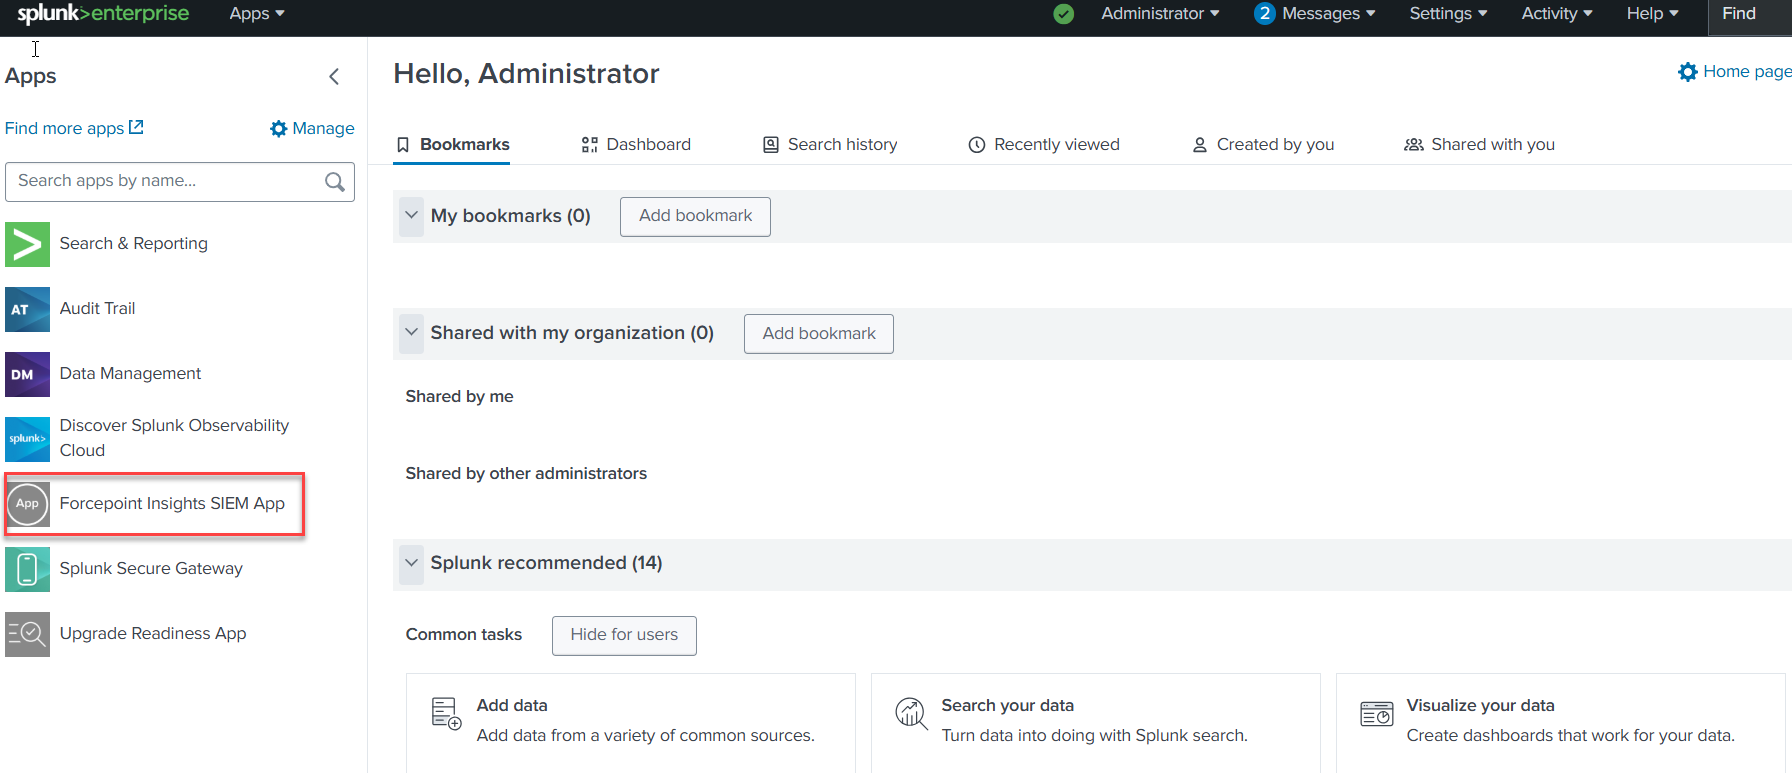
- After the successful installation, you will now see the Forcepoint Insights SIEM App on the left column.
- Enter your Splunk account login credentials and click Agree and Install. It will require you to restart your Splunk instance.
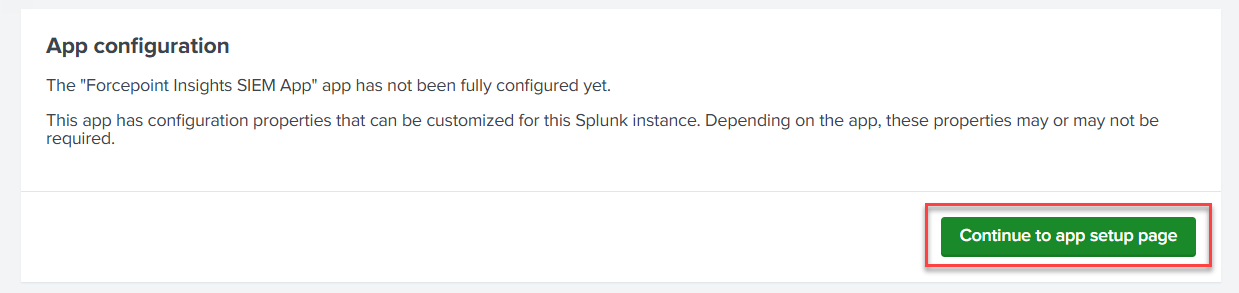
- Select Forcepoint Insights SIEM App on the left column and then click Continue to app setup page on the next window that pops up to configure the
settings.
- Fill out the fields on the Forcepoint Insights SIEM App Configuration page:
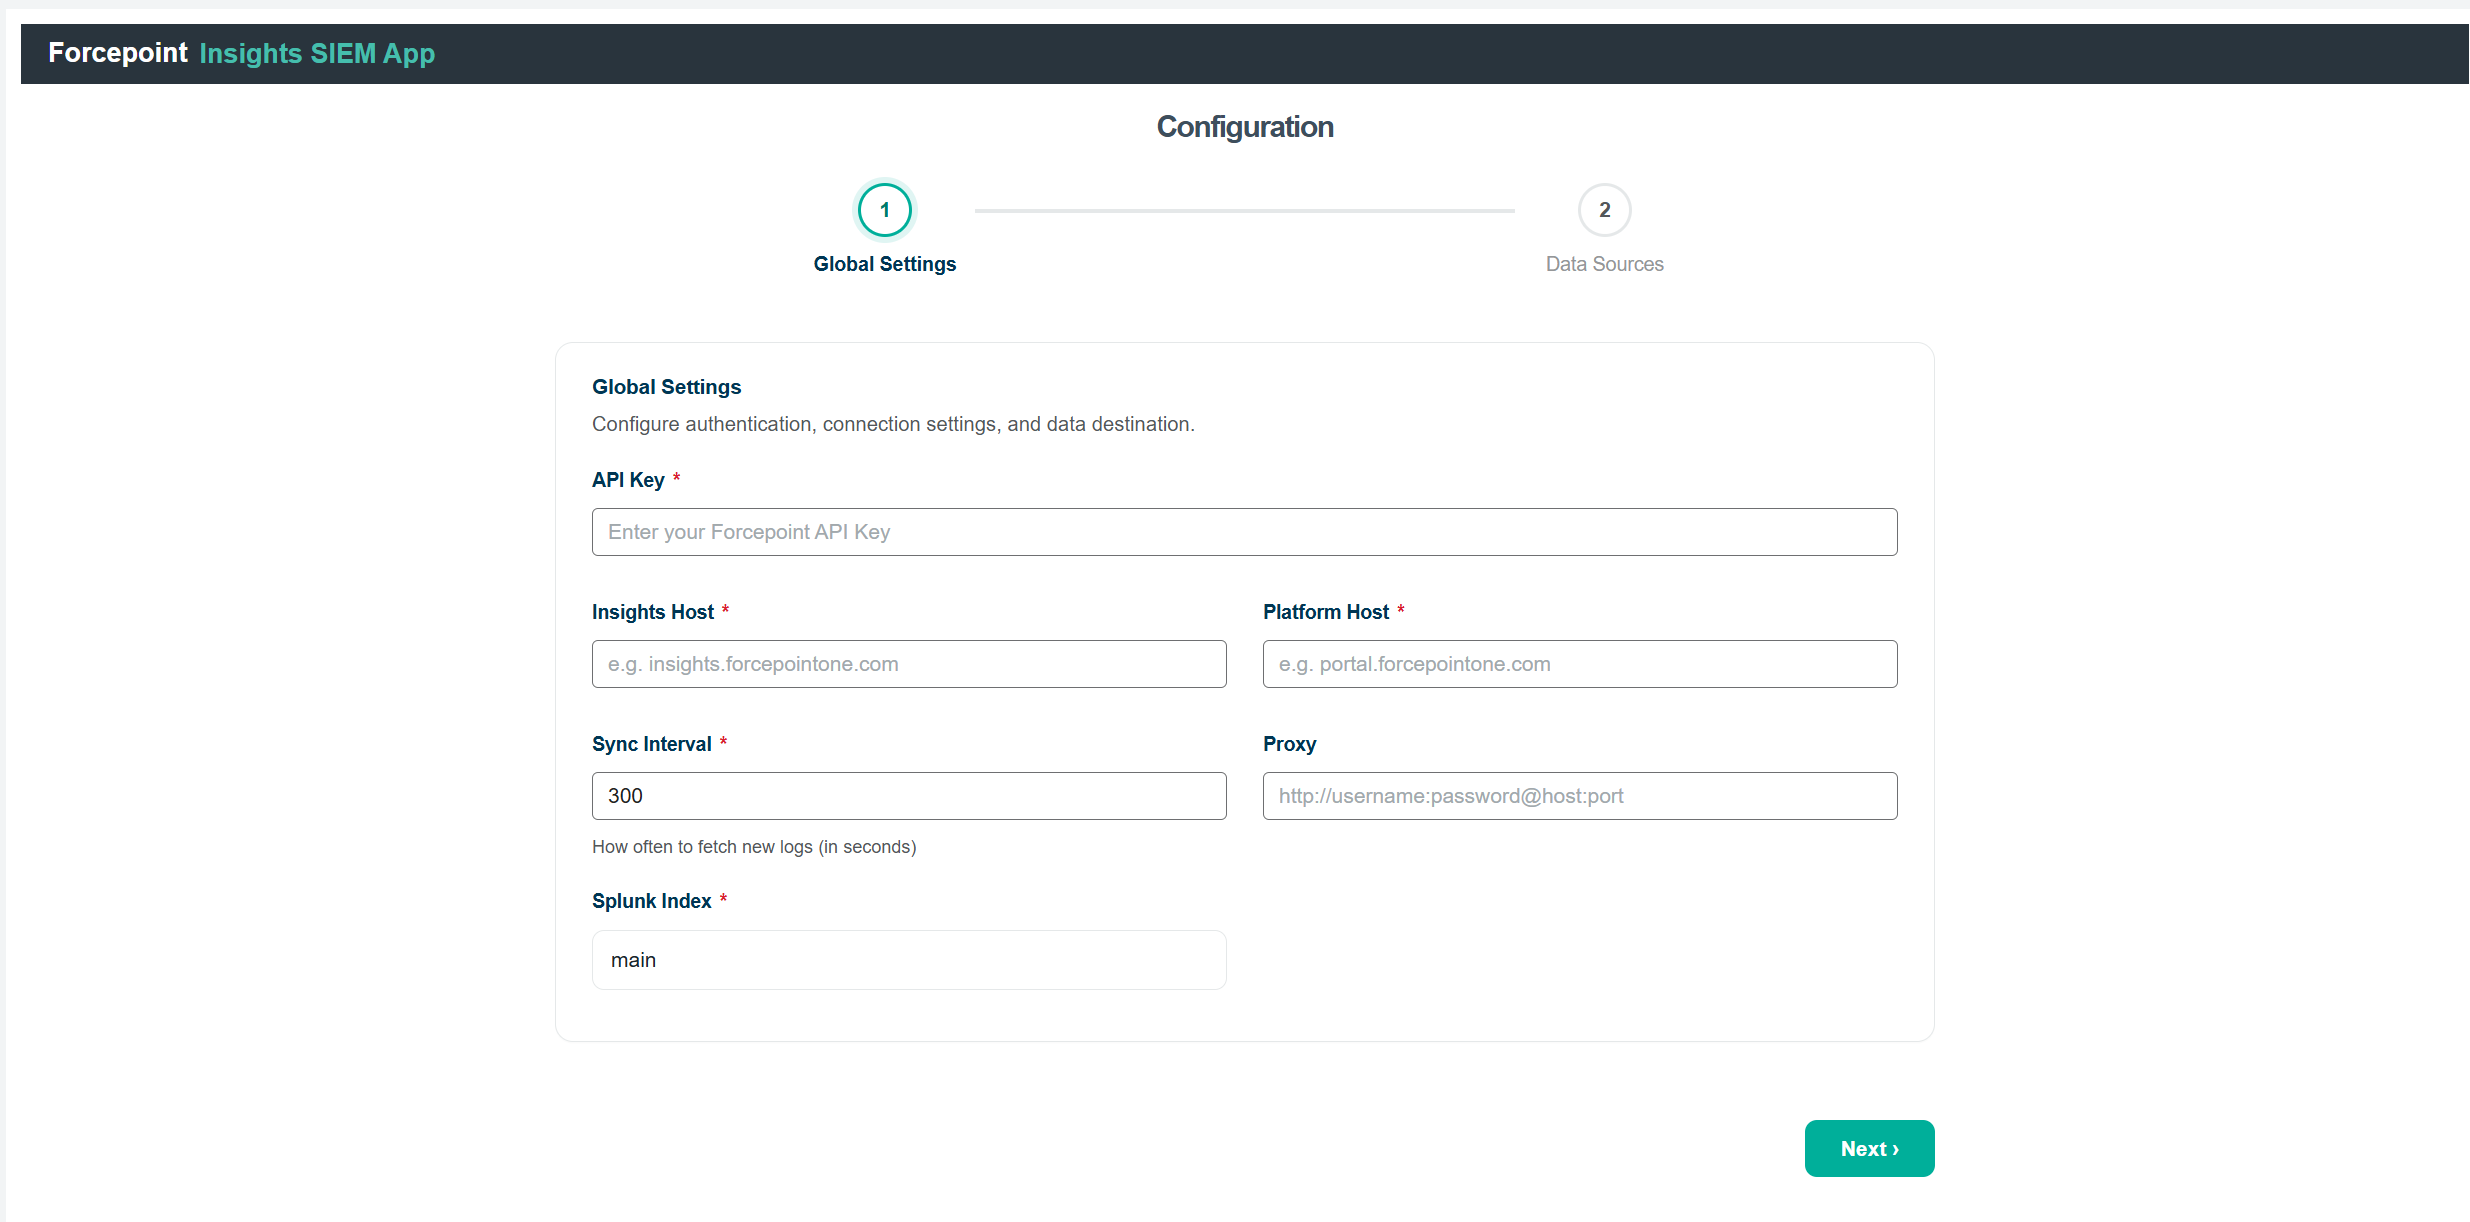
- API Key: Enter the Tenant API Key.
- Platform Host: Enter the Platform Host. For example: portal.forcepointone.com
- Insights Host: Enter the Insights Host. For example: <tenanthost>.insights.forcepointone.com
- Sync Interval: Specify the interval (between 150 and 3600 seconds) at which you want the data to be exported.Note: If the sync interval is set below 300 seconds, please contact the Forcepoint Support Team to address potential rate-limiting issues.
- Proxy (Optional): Leave this field blank unless you need to route API calls through a proxy. If so, provide the required proxy details here. It should be in format as http://username:password@host:port
- Splunk Index: From the drop-down menu, select the index where the data should be stored.
To create a new index, navigate to Settings > Data > Indexes.
For more details on managing indexes, refer to: Managing indexes in Splunk.
Once all configurations are complete, click Next.
- Data Sources
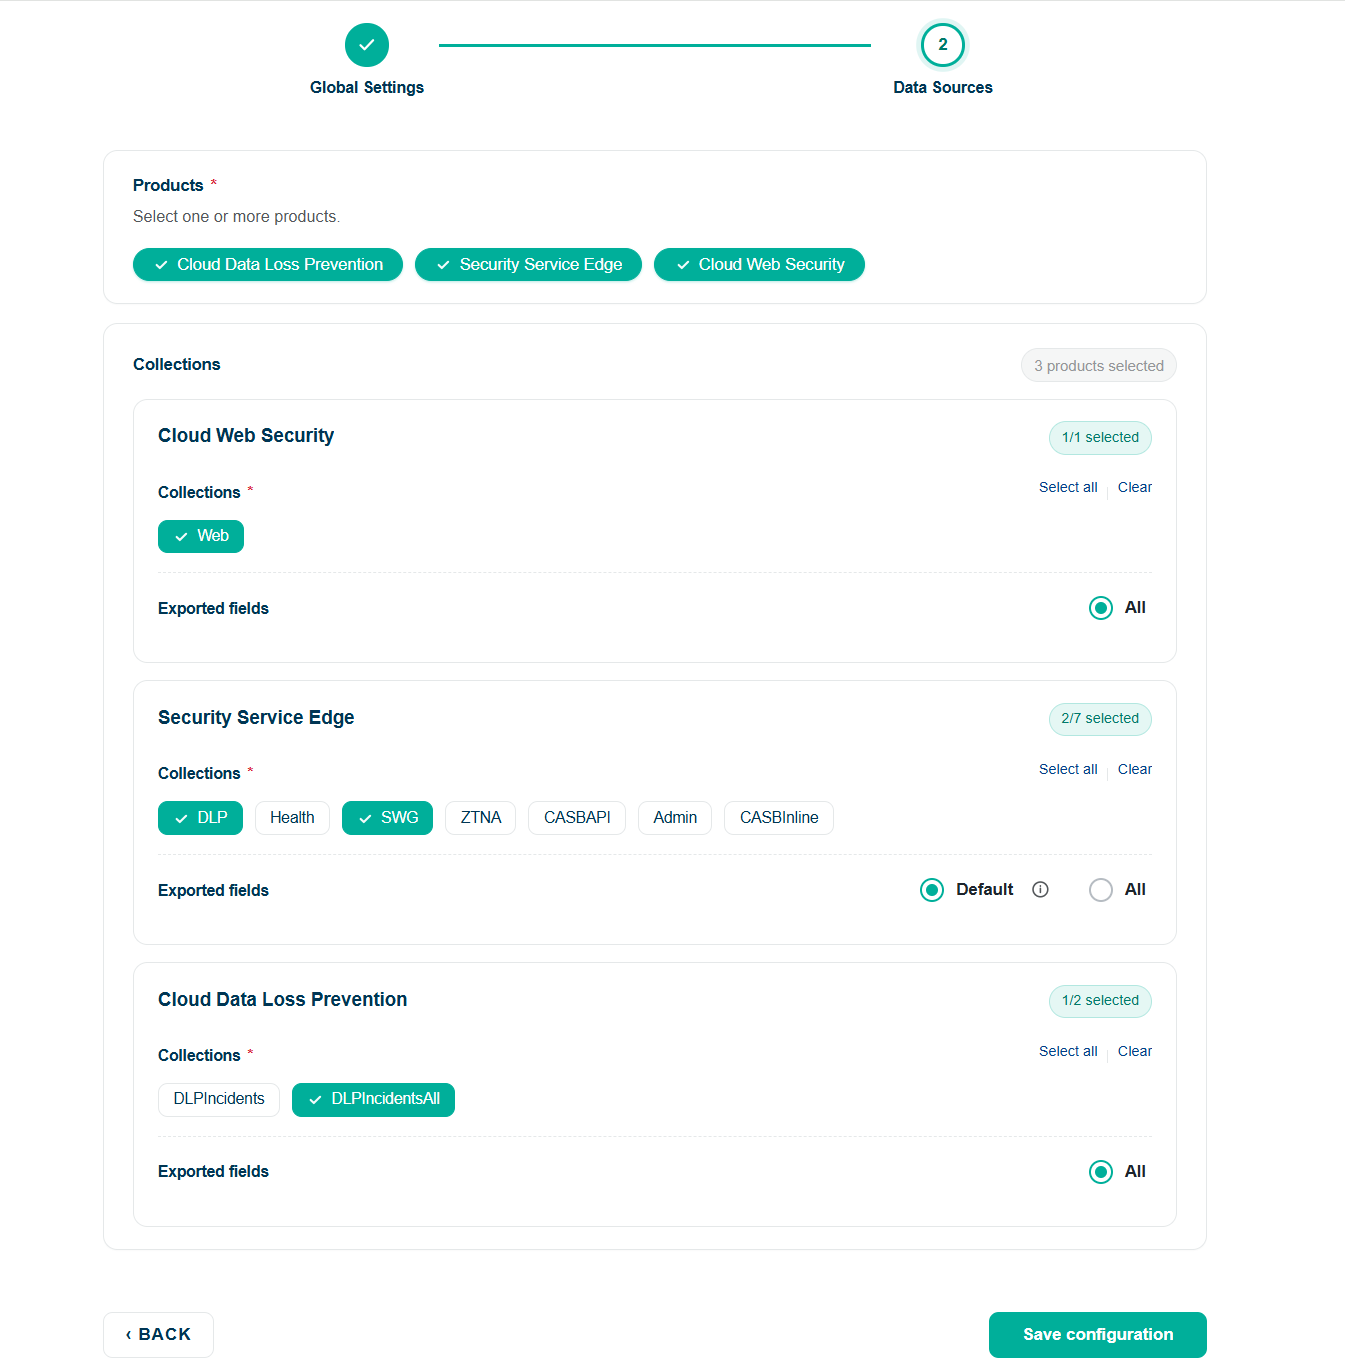
Products: Select one or more products for data export. Available options include Security Service Edge (SSE) , Cloud Data Loss Prevention (Cloud DLP) and
Cloud Web Security-
Collections: For each selected Products, select one or more collections from which you want to export data.
-
Exported Fields: For each selected Products select the type of fields you want to export.
- Default Fields: Choose this option to export only the default fields. For detailed information about the default fields available for collections, refer to this document.
- All Fields: Select this option to export all available fields from the collections. List of available fields for Web collection from Cloud Web Security can be found here: <link>
Once all configurations are complete, click Save Configuration to apply the changes.
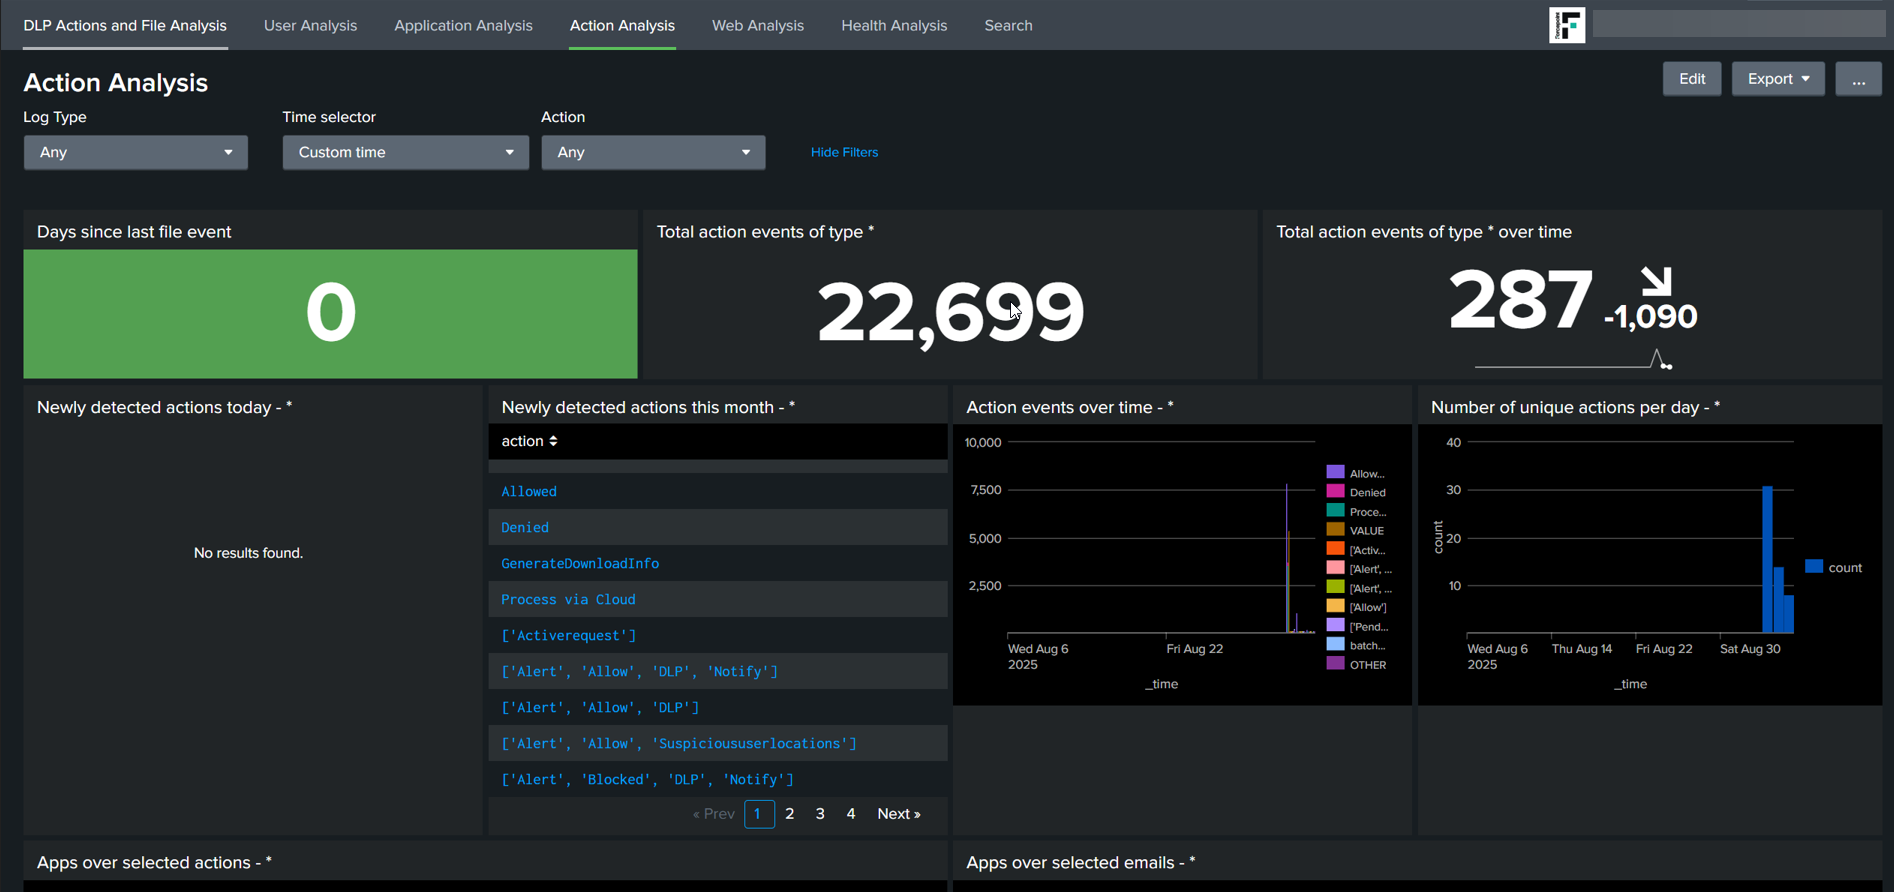
- Once you click Save you will be taken to the Forcepoint Data Security Cloud App Dashboard. Give it a few minutes before logs are pulled over and you see log
results for Secuirty Service Edge (SSE) product.