Admin Web Portal
The Admin Web Portal user interface allows you to verify the state of the sandbox machine availability, to manually submit samples (useful for troubleshooting), to view and edit the default analysis profile, to view reports, and to administer the Admin account (add/remove other accounts).
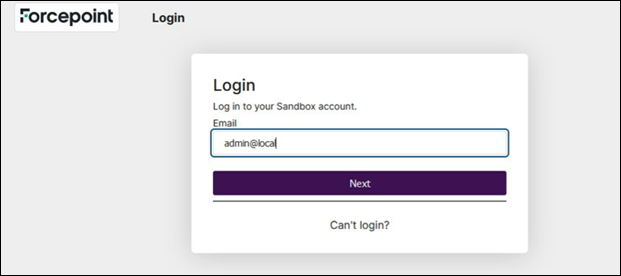
- Log into the Admin Web Portal with the email address and password of the user you added on the Manager in the Organization screen of the wizard.
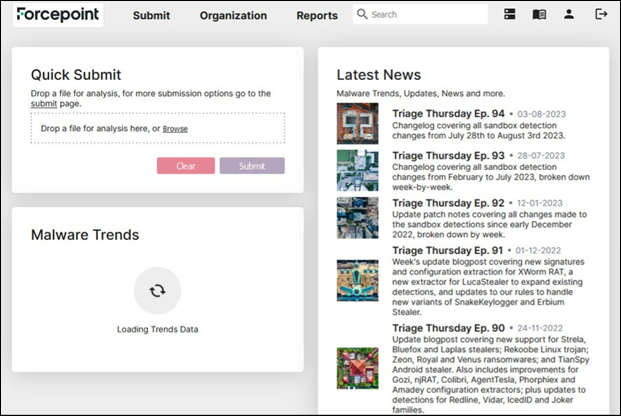
The dashboard is the initial view when logging into the portal.
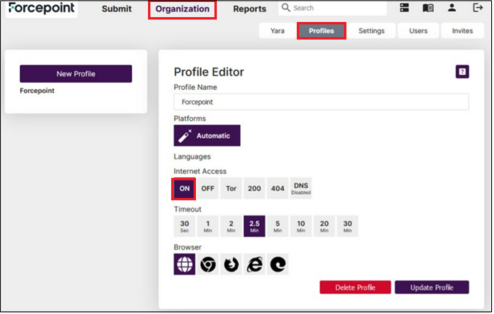
- Profiles control various aspects for control of the sandbox detonation. Select the Organization tab, then select Profiles. The default profile used
for sample analysis is called “Forcepoint”. The default for Internet access is OFF to enhance the security of the system. There is a trade off in setting
internet access to off in a loss of efficacy and each customer should determine what best suites their needs.CAUTION:The default profile (Forcepoint) should not be deleted.
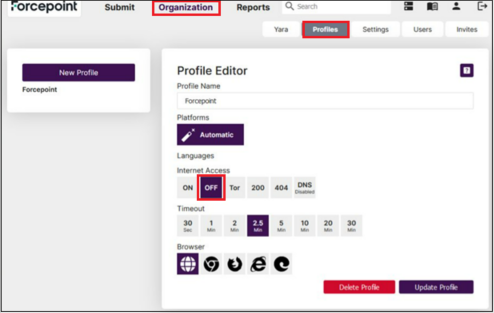
Here we modify the Forcepoint profile to enable Internet access (setting changed to ON).
- The Machines tab is selected via the icon highlighted in red below (just left of the docs/help icon). Here is the initial configuration after an Engine has been
configured and added to the Manager. The Environments count reflects the total of the instance counts for each configured virtual machine. The Parallel count is the number of environments
which can be executed simultaneously. That value is set when the Engine is initially configured and based on the number of CPUs in the Engine.
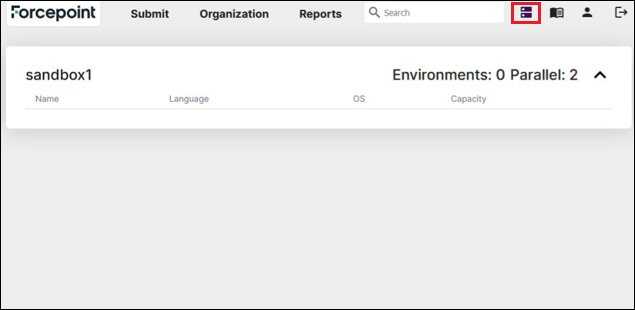
Once the VMs have been built, the available machine types are shown on the Machines tab. Note for this example, there are 6 environments available (3 windows 10, 3 windows 11), and 2 VMs can operate in parallel. If an analysis requires a machine type but all the parallel slots are in use, the analysis will be queued until a parallel slot becomes available.

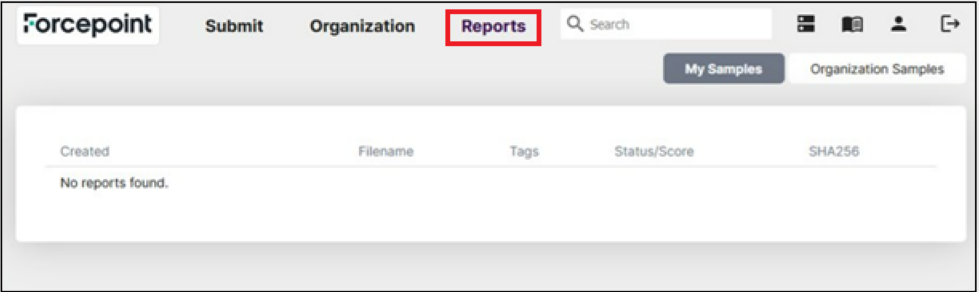
- Selecting the Reports tab shows the samples which have been submitted and the associated analysis. My Samples only shows samples for the user
logged into the portal. To see samples/reports which were submitted to the Manager, select the Organization Samples tab.
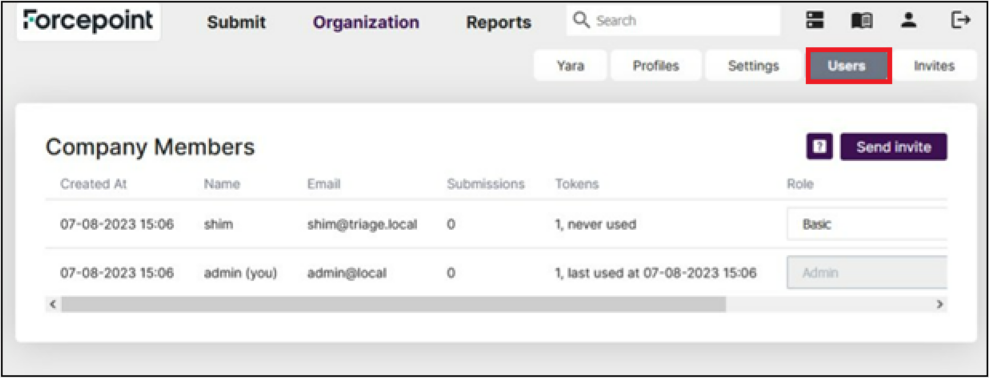
- Selecting the Users tab allows you to view the configured Users for the system. There is a reserved user “shim@triage.local” which is used to relay the samples
received by the Manager. You should not modify or delete this user.The user with (you) indicates the currently logged in user, which is the user created in the registration wizard on the
Organization (web portal) screen for the Manager.
- The Submit tab allows for manual upload and analysis of files.
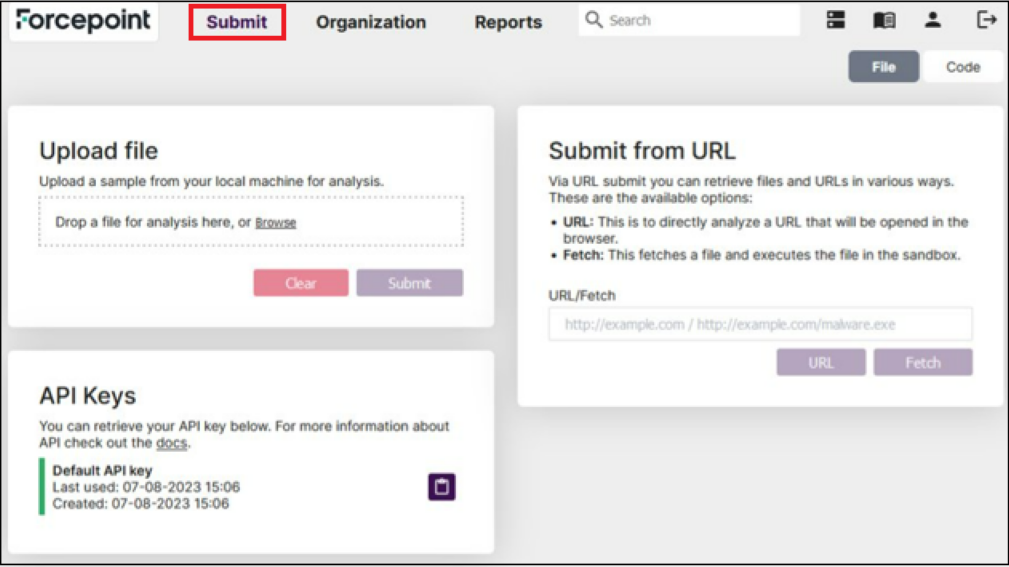 Note: Files submitted through the Admin Web Portal will not generate a score visible to other products integrating with AMDP.
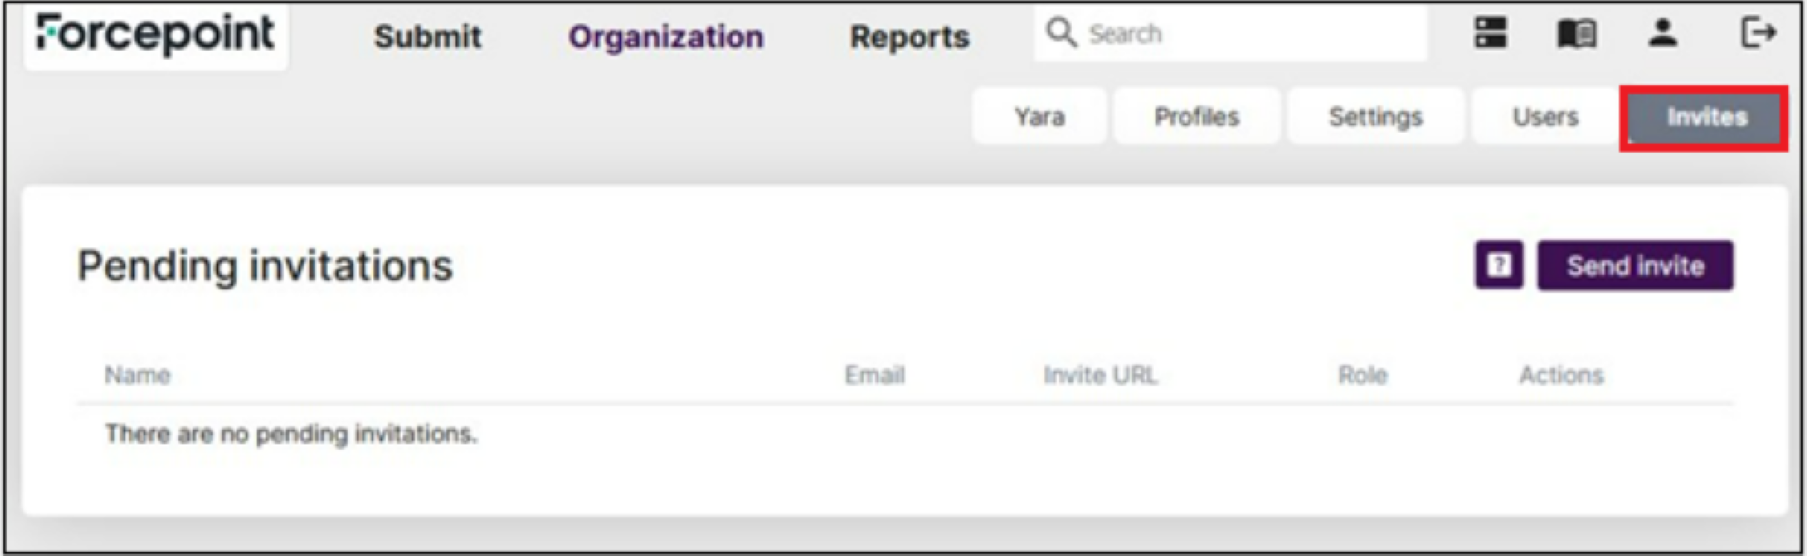
 - The Invites tab is used to craft an invitation with initial login details for a newly created user. The primary use case is to add other Portal Administrator accounts.
Delivering invitations via the email channel is not supported. An Admin should select a pending invitation and click the clipboard icon to copy the invite URL. The Admin should then send the invite URL to the intended new user using their email application or some other method.
The new user then follows the link provided in the invite to setup their new account.