Viewing SSPM report
You can view the SSPM report from Analyze section.
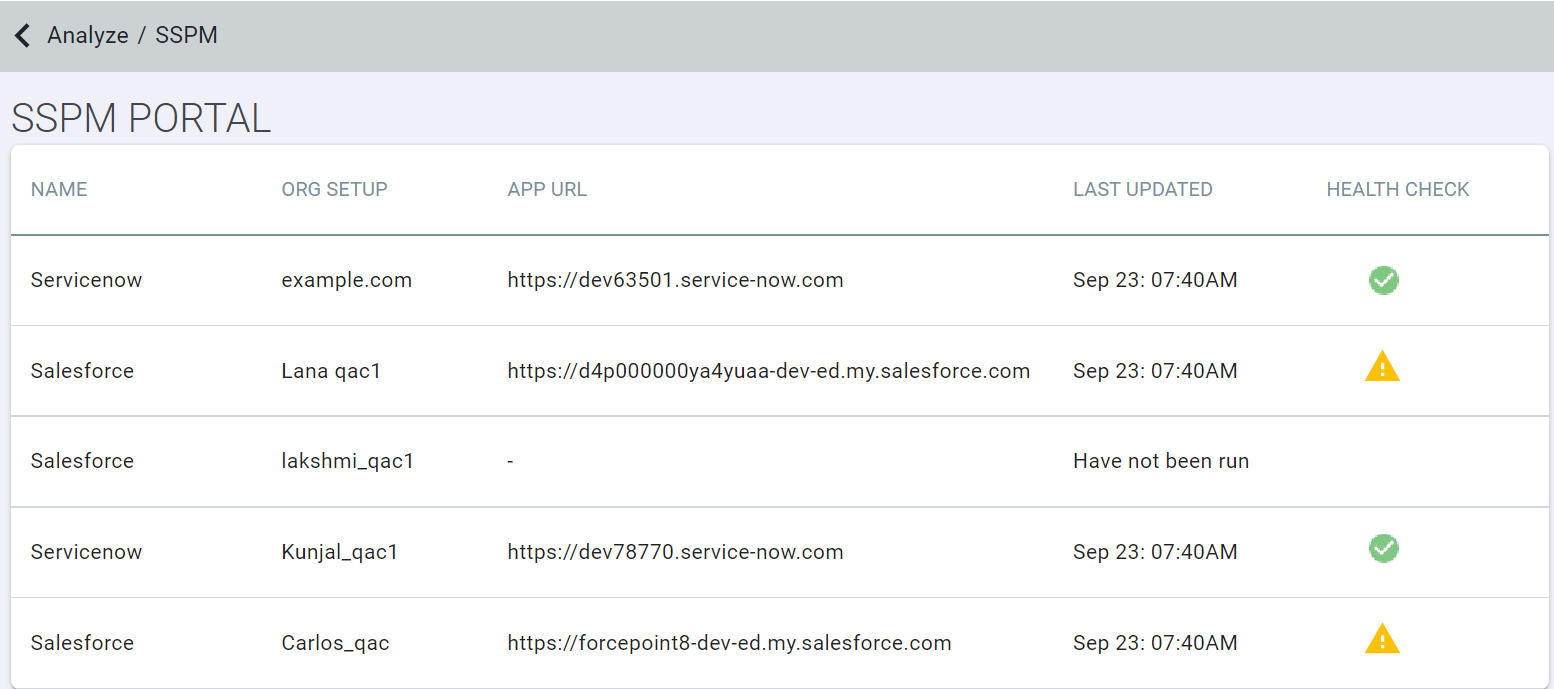
The initial SSPM page will list each app instance, the org and URL, last date scanned as well as the current health of the scan. Green check indicates that the app instance does not currently have any compliance rule violations while the yellow exclamation point will indicate that at least one compliance rule is being violated.
Clicking into one of the app instances will bring up that particular SSPM report.
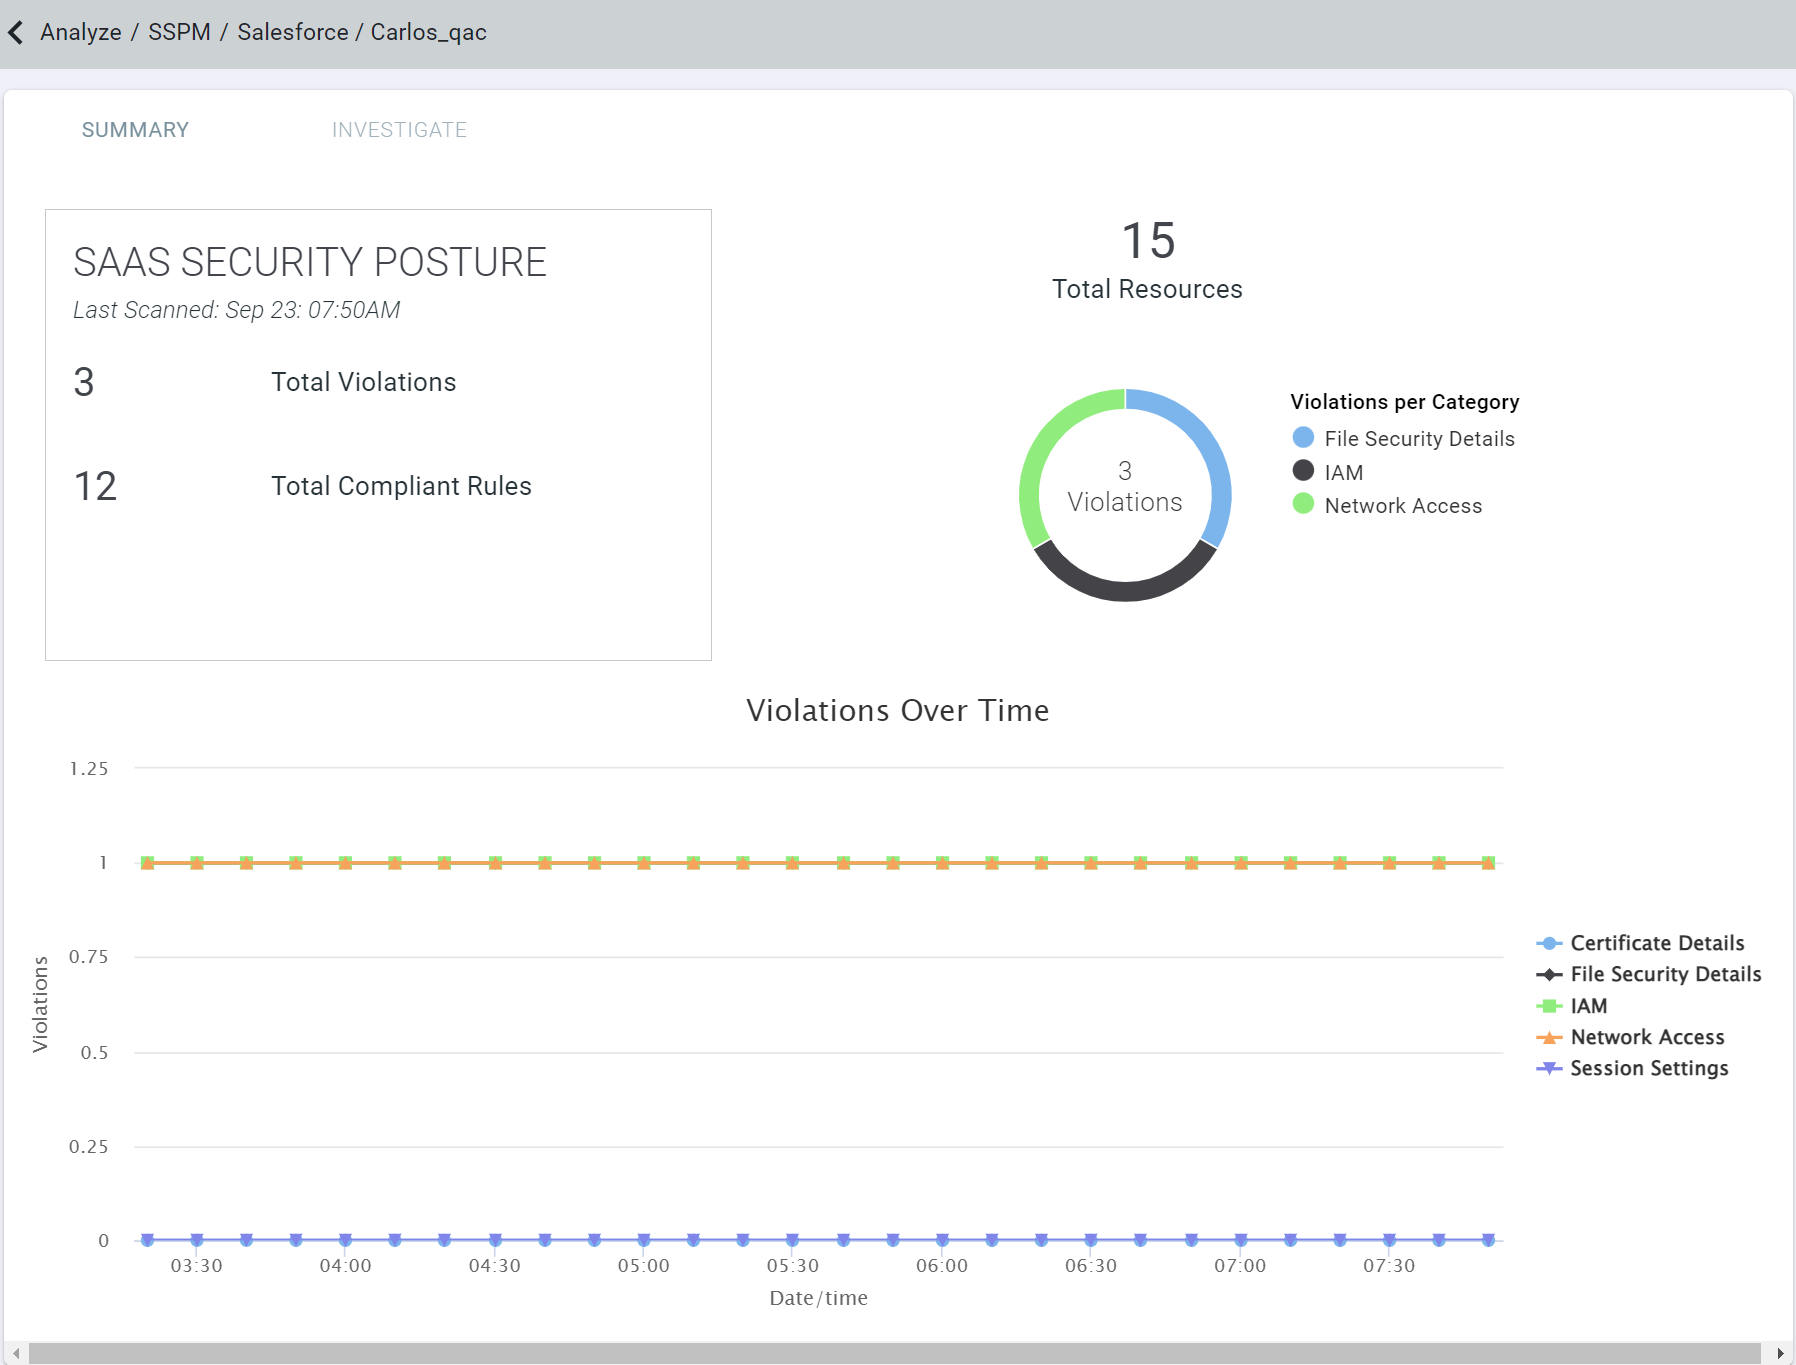
The report displays:
- How many resources are being scanned for that app (Salesforce has 15 rules we can scan for)
- Overall health and how many rules are being violated.
- Violations by category
- Graph displaying changes overtime.
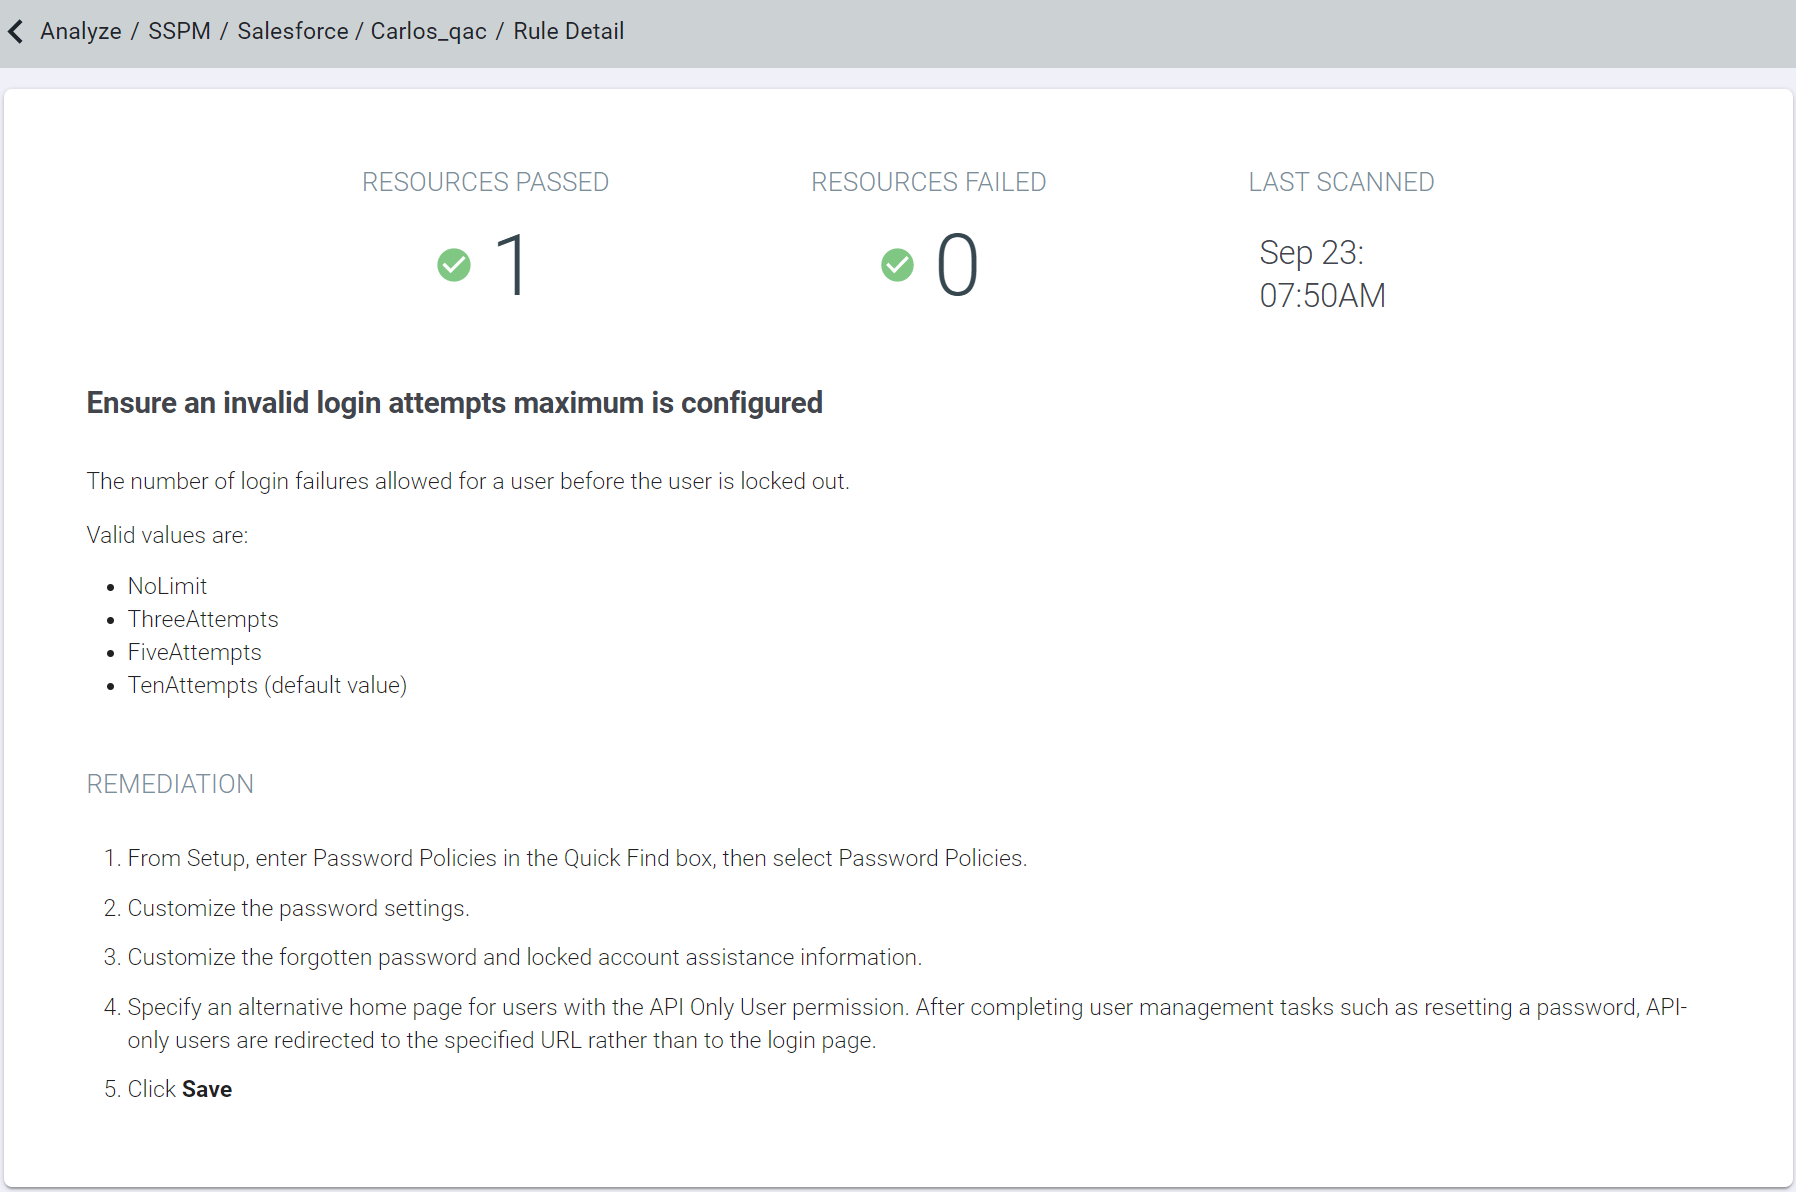
Clicking the Investigate tab at the top will give you a break down of each of the 15 rules and which ones you are not compliant in. Clicking into one of the rules will explain what it does and how to remediate (if you are in violation).
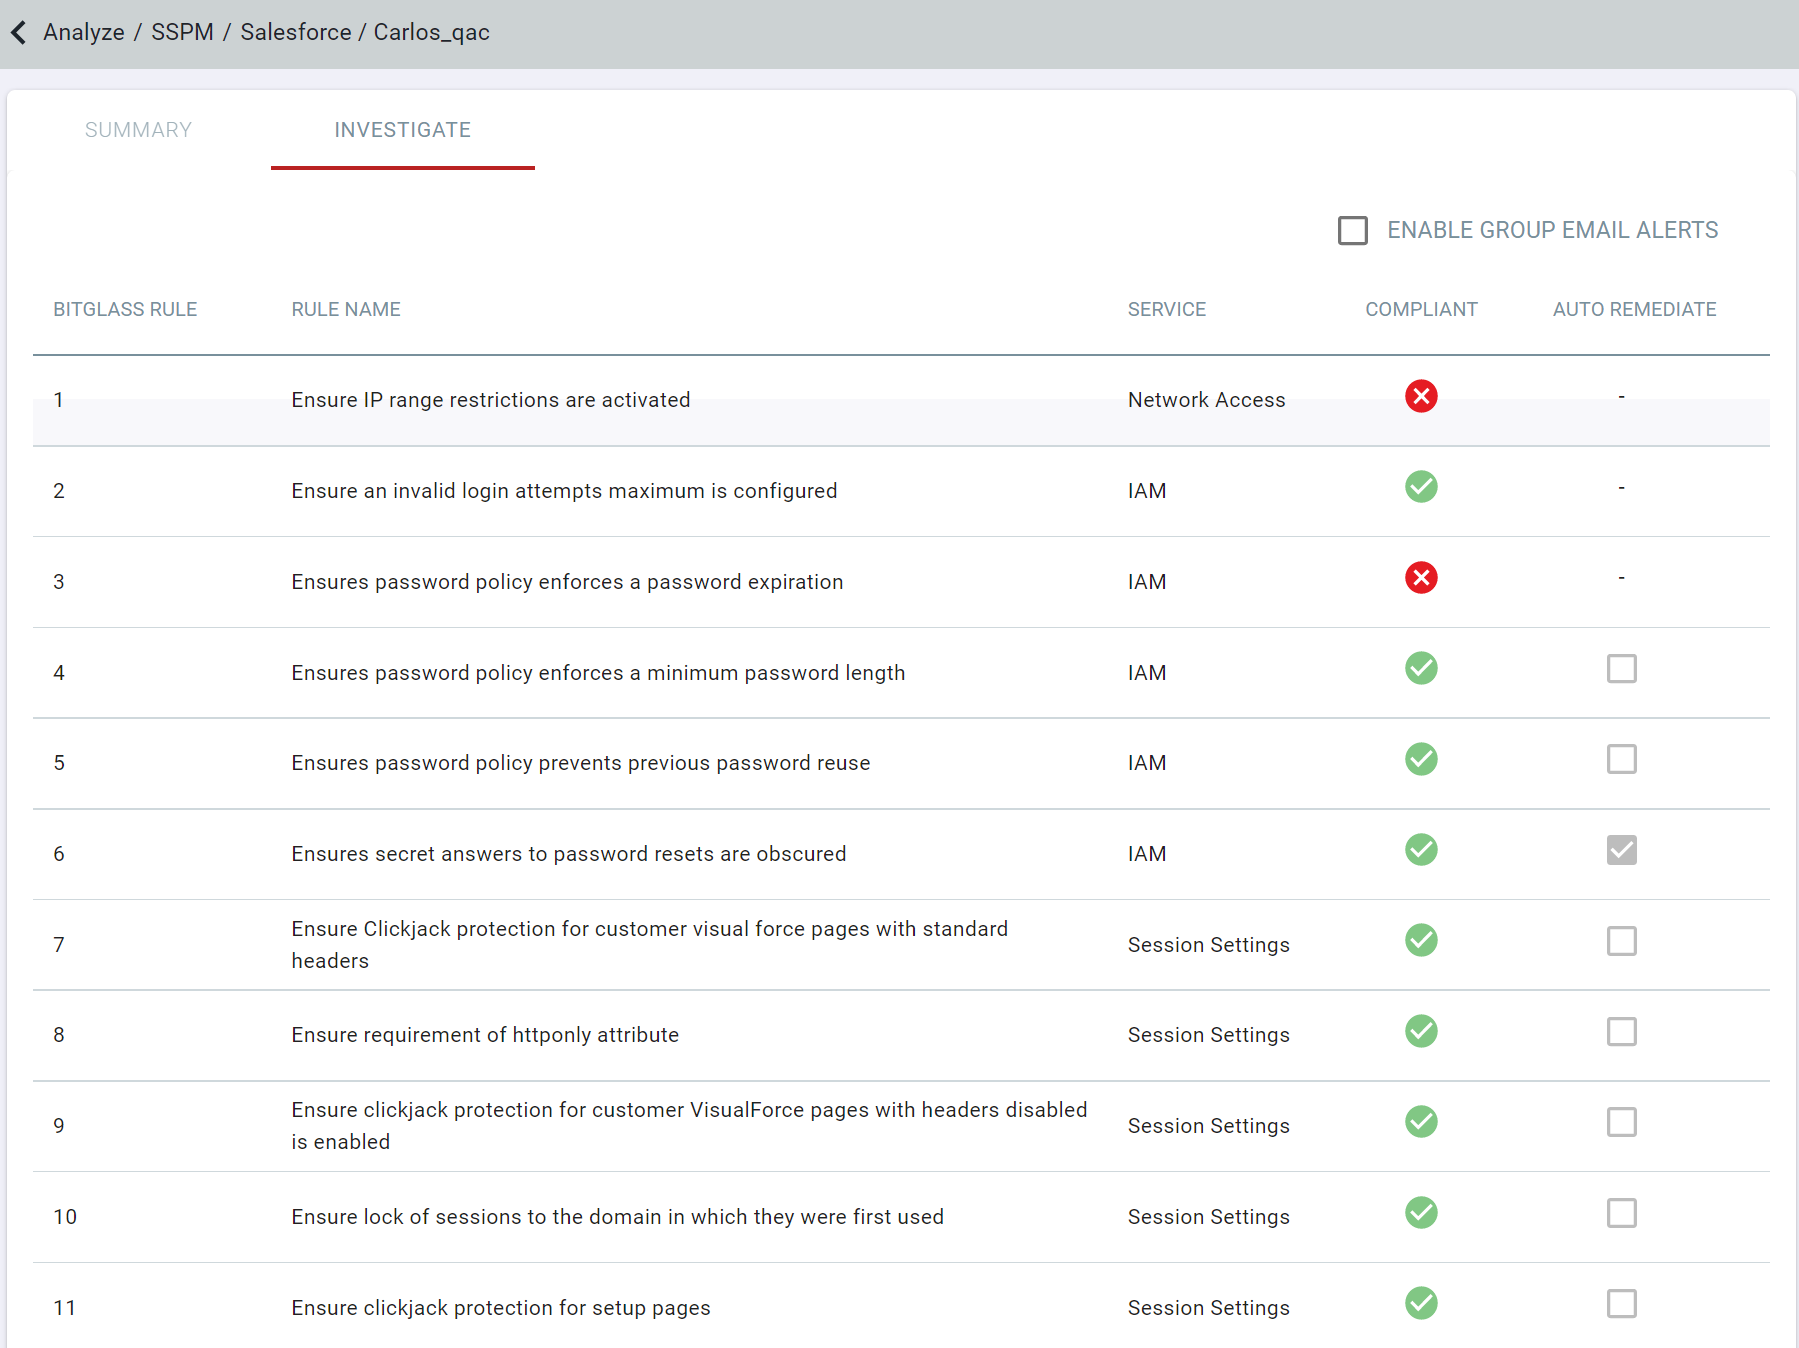
You will note that you are able to enable auto remediation for rules that can be auto remediated. Other rules will require manual remediation due to the nature of the setting (in the example picture you need to enter a valid IP address for IP range restriction).