Reviewing Data in Motion tab in Threat dashboard
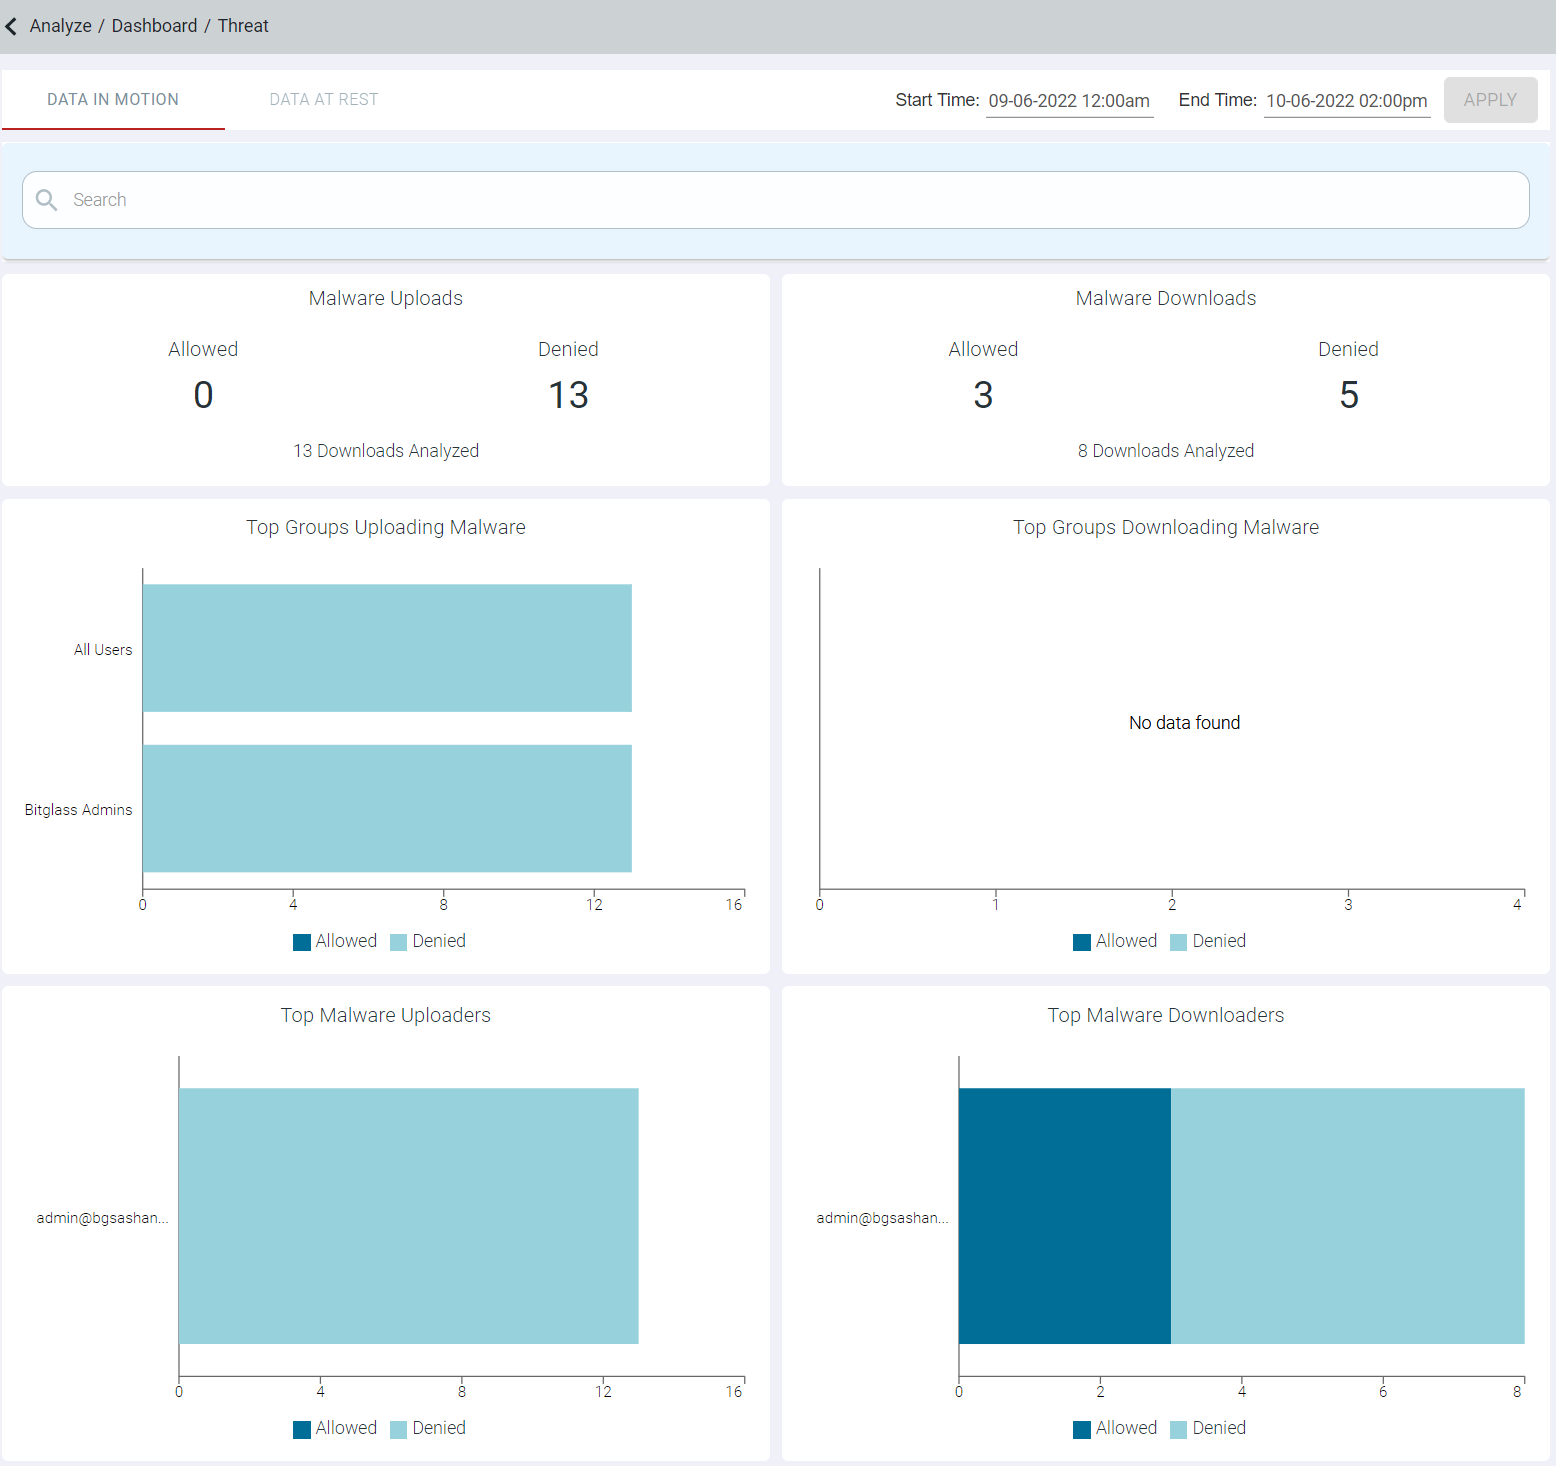
The Data in Motion dashboard consolidates all the malware events of the data that is in transit and inline over the proxy, SmartEdge Agent, Cloud SWG and ZTNA (Agentless and Agent based).
This will help admins get a quick overview of possible risky activity occurring in real time in their protected cloud applications.
Filtering
You can further filter the information by selecting the appropriate filter from the Search drop-down list on top of date range.
Follow the below steps to filter the information:
- Click into the Search box and select the Field option you are filtering by.
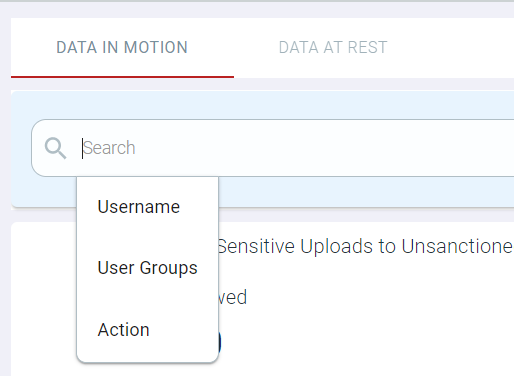
Available options are Username, User Groups and Action.
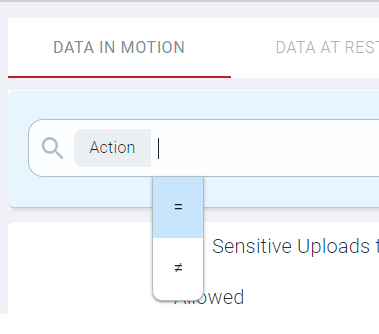
On selecting the field option, Operator drop-down list appears.
- Select the appropriate operator from the drop-down list.
Available options vary as per the field option selected. Available options are equals, does not equal and Contains.
- Enter the text or select the option from the drop-down list to filter the information.
- If you select Username or User Groups from the Field drop-down list, then you can select available Username or group from the drop-down list.
- If you select Action in the Field drop-down list, then select the applicable value. Available options are Allowed and Denied.
On entering the text or on selecting the option from the drop-down list, AND function appear.
- Select the AND function to continue your exact match filter.
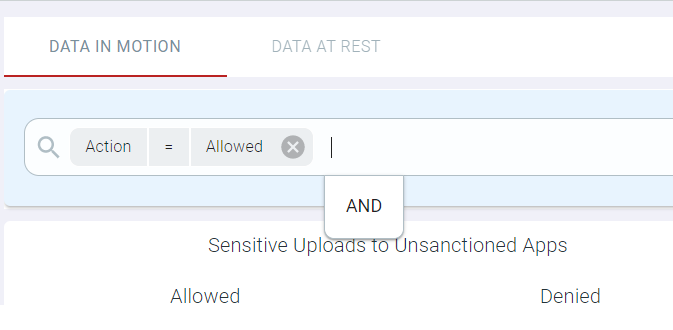
You can then continue to add refined filters as desired. Once ready to search, click into the space and press enter.
Malware Uploads
The Malware Uploads widget indicates number of times the files with malware was uploaded and upload was denied to the applications. The Malware Uploads widget also displays total malware uploads analyzed.

- Allowed
You can drill down the Allowed logs by clicking the number below the Allowed to open the Malware Uploads : Allowed page. This page contains a horizontal chart with allowed Malware Event Count in the x-axis and SWG, Proxy and ZTNA bars in the y-axis.

You can further drill down the SWG malware uploads by clicking the SWG bar and then by clicking Drill into SWG to open the Malware Uploads : SWG page. This page contains a modal table with the Time, File Name, App Name, Domain and Username fields.
You can further drill down the ZTNA malware uploads by clicking the ZTNA bar and then by clicking Drill into ZTNA to open the Malware Uploads : ZTNA page. This page contains a modal table with the Time, File Name, App Name, Domain and Username fields.
You can also further drill down the Proxy malware uploads by clicking the Proxy bar and then by clicking Drill into Proxy to open the Malware Uploads : Proxy page. This page contains a modal table with the Time, File Name, App Name, Domain and Username fields.

- Denied
You can drill down the Denied logs by clicking the number below the Denied to open the Malware Uploads : Denied page. This page contains a horizontal chart with denied Malware Event Count in the x-axis and SWG, Proxy and ZTNA bars in the y-axis.
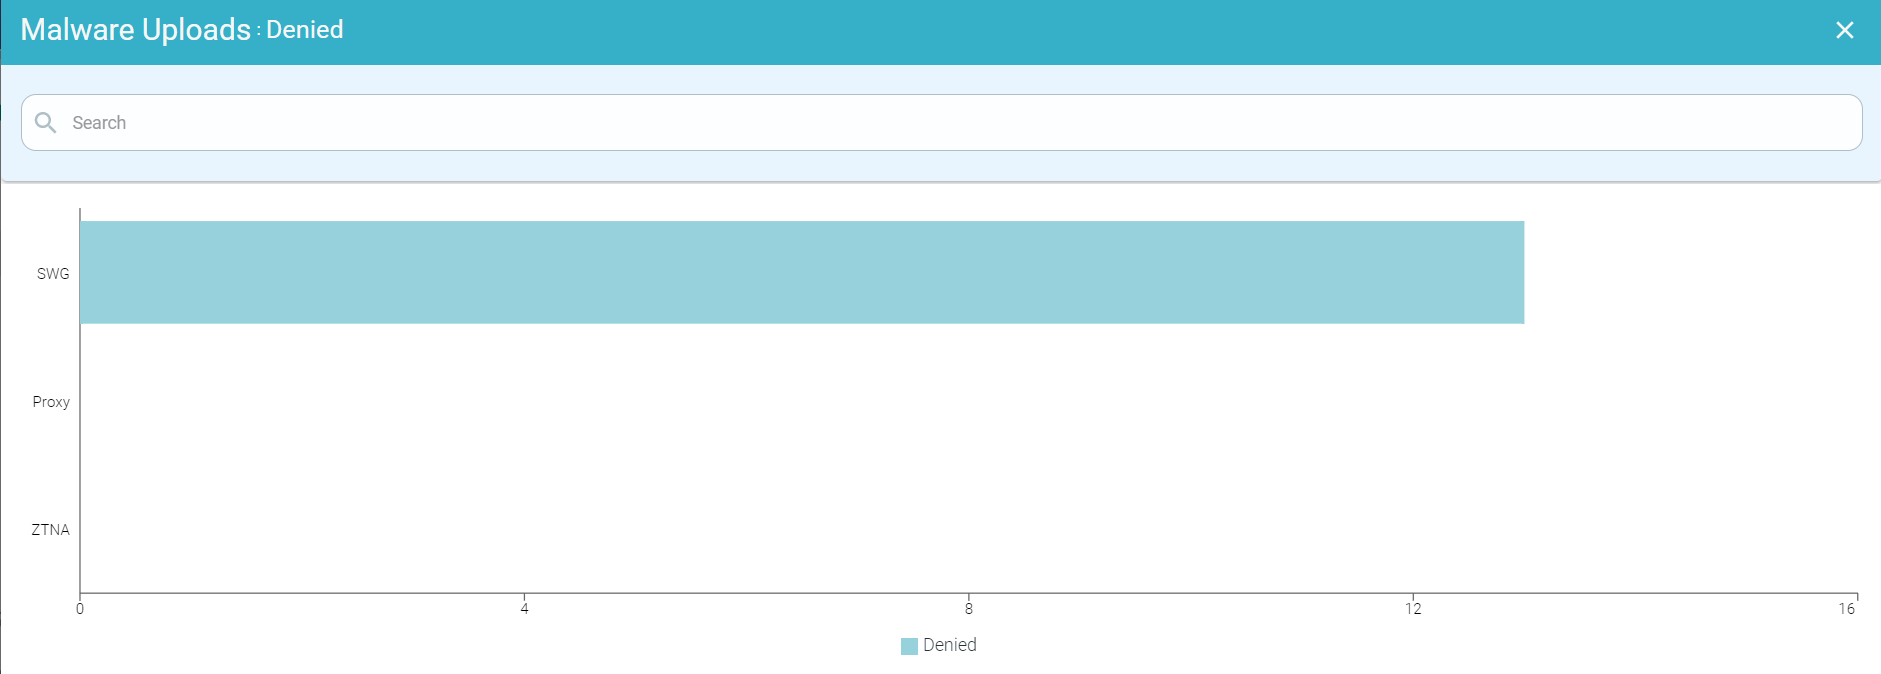
You can further drill down the SWG malware upload denied data by clicking the SWG bar and then by clicking Drill into SWG to open the Malware Uploads : SWG page. This page contains a modal table with the Time, File Name, App Name, Domain and Username fields.
You can further drill down the ZTNA malware upload denied data by clicking the ZTNA bar and then by clicking Drill into ZTNA to open the Malware Uploads : ZTNA page. This page contains a modal table with the Time, File Name, App Name, Domain and Username fields.
You can also further drill down the Proxy malware upload denied data by clicking the Proxy bar and then by clicking Drill into Proxy to open the Malware Uploads : Proxy page. This page contains a modal table with the Time, File Name, App Name, Domain and Username fields.
Top Groups Uploading Malware
The Top Groups uploading Malware widget indicates top 10 groups uploading malware data.
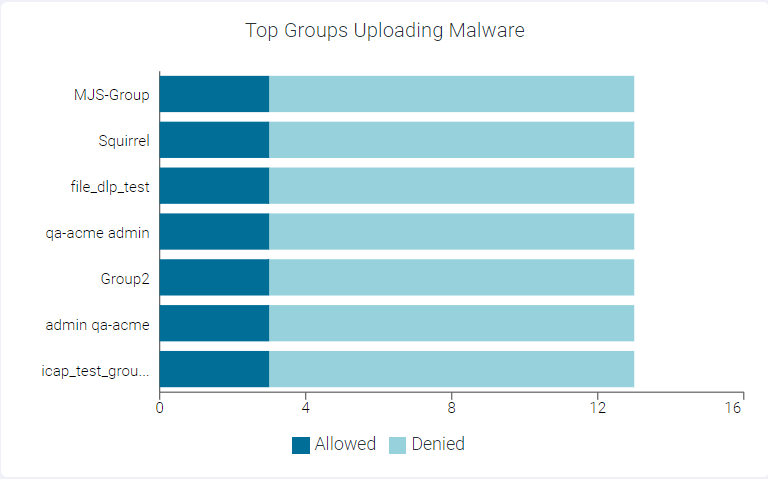
You can view Allowed or Denied data only by clicking the respective ledger at the bottom of the widget. Click the same ledger again to view the data for Allowed and Denied on the horizontal bar charts.
You can drill down the data at different levels:
- Drilling down at Group Level

To drill down at group level, click the name of the group and click Drill into <groupname> to open Top Groups Uploading Malware: <groupname> page. This page displays modal table with App Name, Domain, Malware Event Count, DLP Action and User Count fields.

- Drilling down the Allowed data of a Group
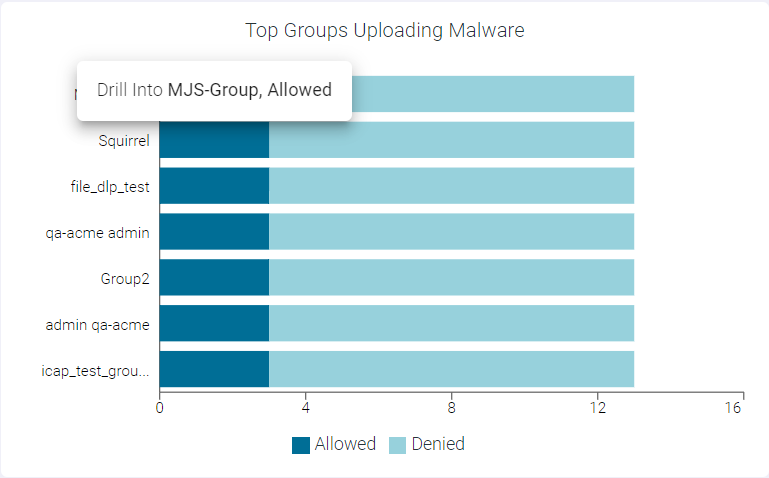
To drill down the allowed data of a group, click the Allowed split bar of the group and click Drill into <groupname>, allowed to open the Top Groups Uploading Malware : <groupname>, allowed page. This page displays modal table with App Name, Domain, Malware Event Count and Type fields.

- Drilling down the Denied data of a Group

To drill down the denied data of a group, click the Denied split bar of the group and click Drill into <groupname>, denied to open the Top Groups Uploading Malware : <groupname>, denied page. This page displays modal table with App Name, Domain, Malware Event Count and Type fields.

Top Malware Uploaders
The Top Malware Uploaders widget indicates top 10 users uploading malware data.
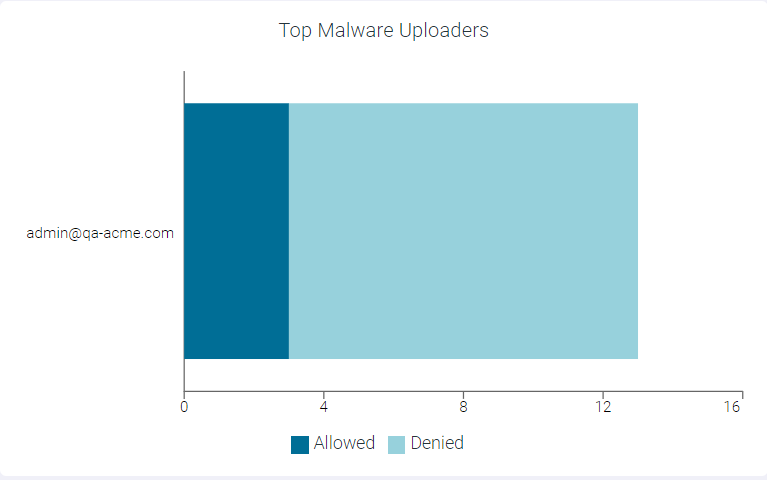
You can view Allowed or Denied data only by clicking the respective ledger at the bottom of the widget. Click the same ledger again to view the data for Allowed and Denied on the horizontal bar charts.
You can drill down the data at different levels:
- Drilling down at User Level
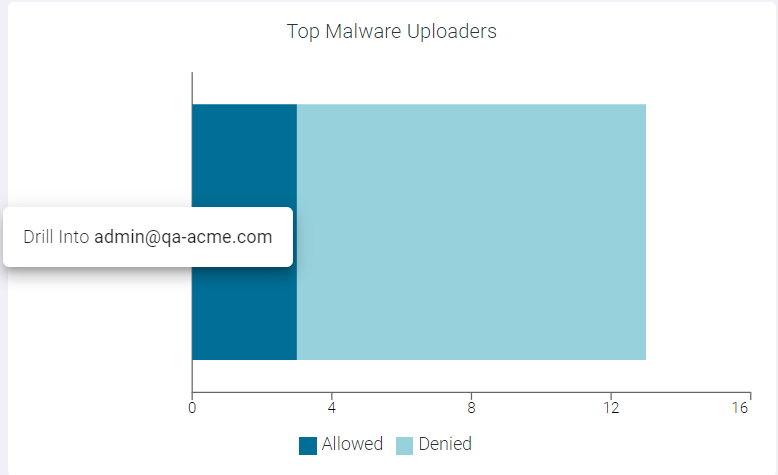
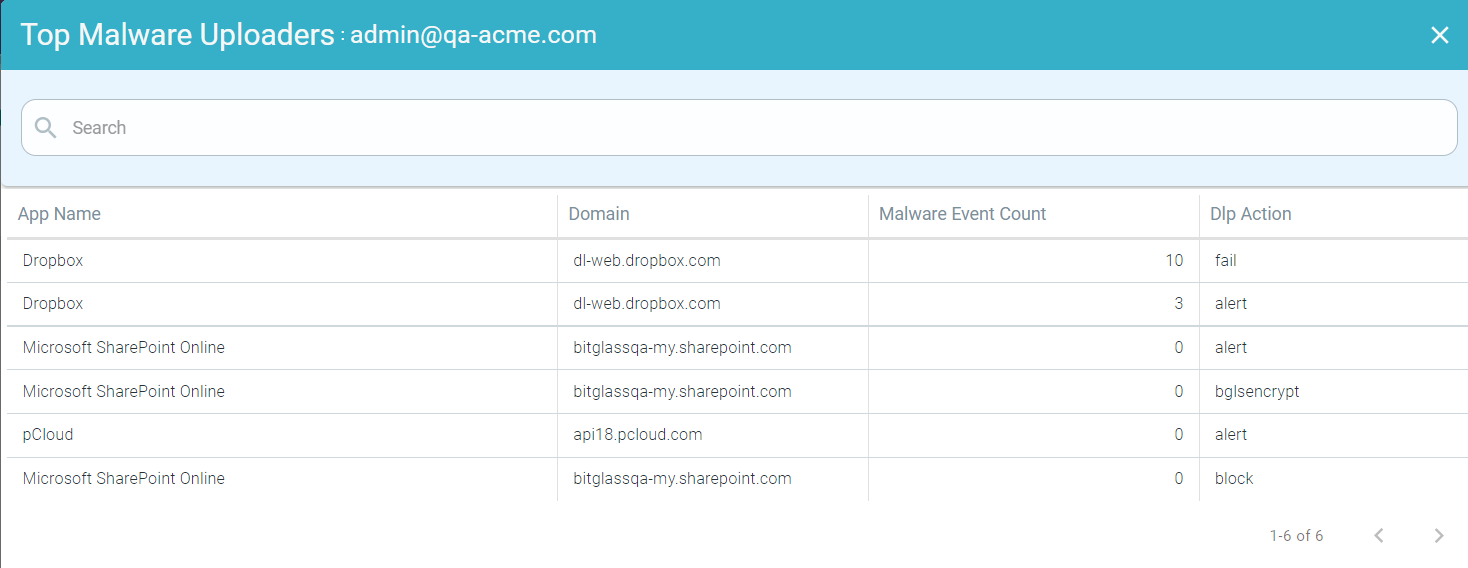
To drill down at user level, click the name of the user and click Drill into <UserName> to open Top Malware Uploaders : <UserName> page. This page displays modal table with App Name, Domain, Malware Event Count, and DLP Action fields.
- Drilling down the Allowed data of a User
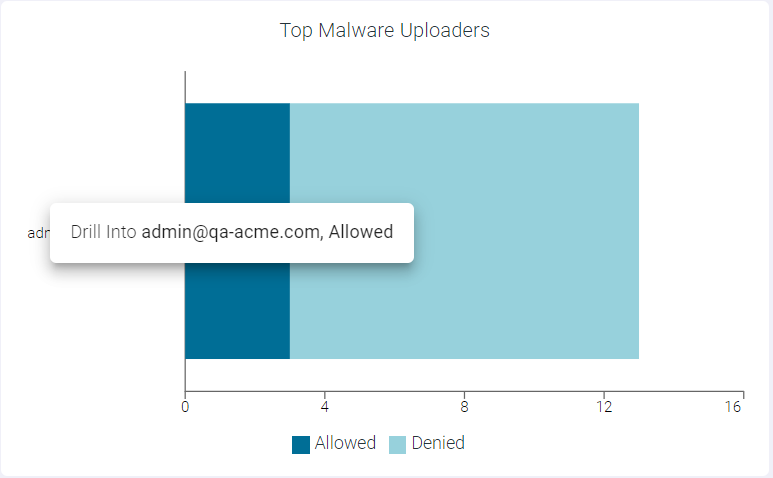
To drill down the allowed data of a user, click the Allowed split bar of a user and click Drill into <UserName>, allowed to open the Top Malware Uploaders : <UserName>, allowed page. This page displays modal table with App Name, Domain, Malware Event Count and Type fields.
- Drilling down the Denied data of a User

To drill down the denied data of a user, click the Denied split bar of a user and click Drill into <UserName>, denied to open the Top Malware Uploaders : <UserName>, denied page. This page displays modal table with App Name, Domain, Malware Event Count and Type fields.
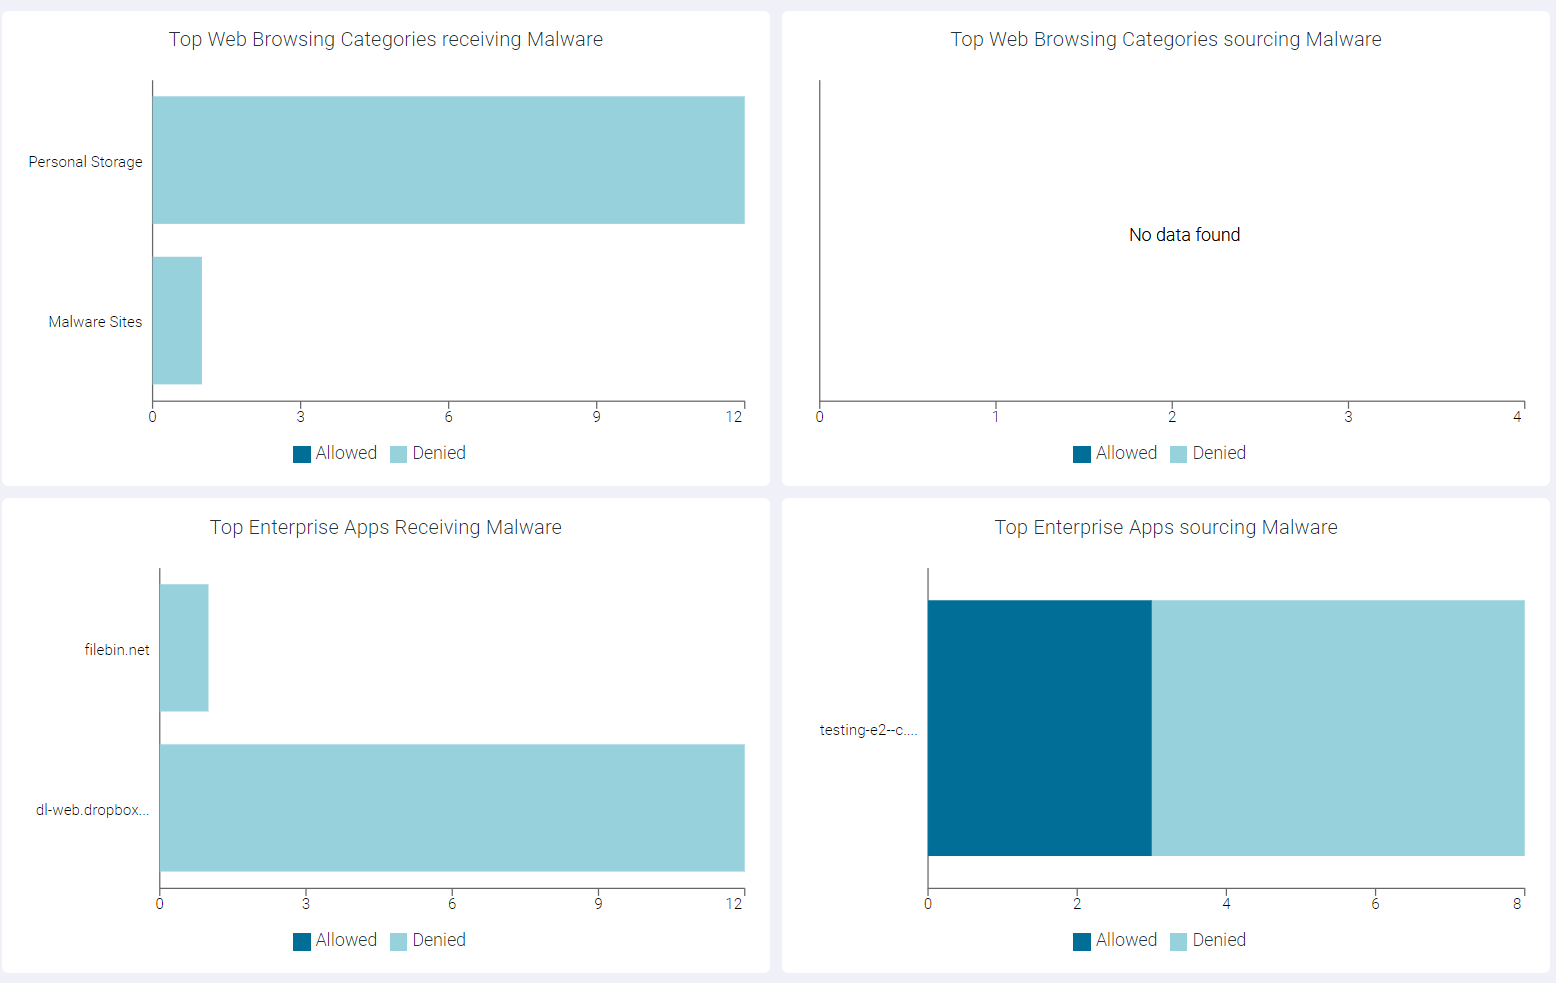
Top Web Browsing Categories Receiving Malware
The Top Web Browsing Categories Receiving Malware widget indicates top 10 web browsing categories receiving malware.
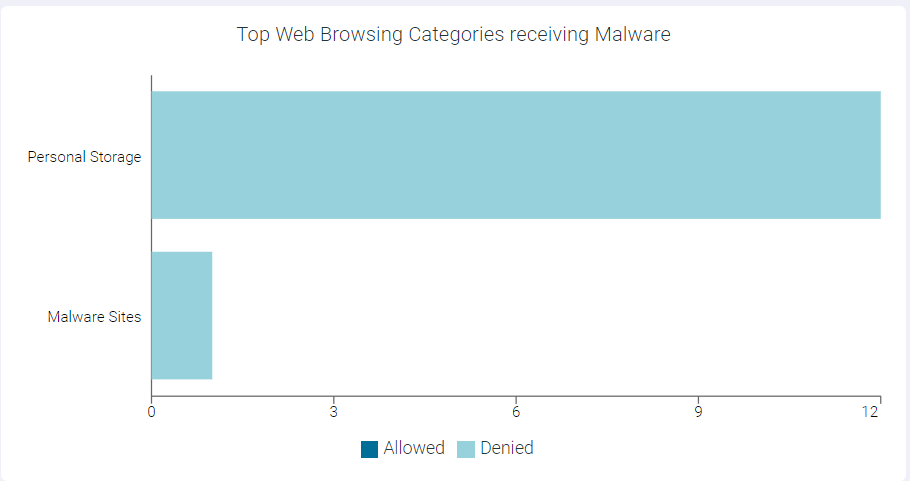
You can view Allowed or Denied data only by clicking the respective ledger at the bottom of the widget. Click the same ledger again to view the data for Allowed and Denied on the horizontal bar charts.
You can drill down the data at different levels:
- Drilling down the Malware by Web Browsing Category

To drill down at web browsing category level, click the name of the category and click Drill into <categoryname> to open Top Web Browsing Categories Receiving Malware : <categoryname> page. This page displays modal table with App Name, Domain, Malware Event Count and User Count fields.
- Drilling down the Allowed data of Web Browsing Category
To drill down the allowed data of the Web Browsing Category, click the Allowed split bar of the web browsing category and click Drill into <categoryname>, allowed to open the Top Web Browsing Categories Receiving Malware : <categoryName>, allowed page. This page contains a horizontal bar chart with allowed Malware Event Count in the x-axis and SWG, Proxy and ZTNA bars in the y-axis.
- Drilling down the Denied data of Web Browsing Category
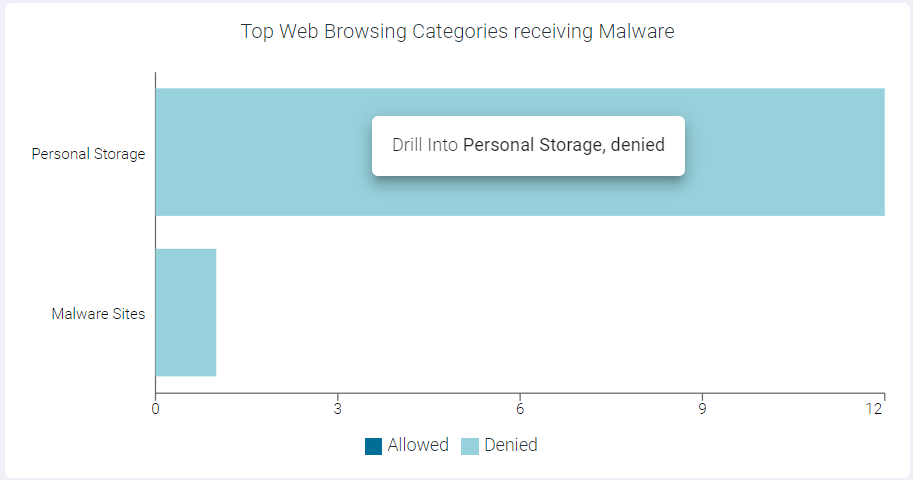
To drill down the denied data of the Web Browsing Category, click the Denied split bar of the web browsing category and click Drill into <categoryname>, denied to open the Top Web Browsing Categories Receiving Malware : <categoryname>, denied page. This page contains a horizontal bar chart with denied Malware Event Count in the x-axis and SWG, Proxy and ZTNA bars in the y-axis.

Top Enterprise Apps Receiving Malware
The Top Enterprise Apps Receiving Malware widget indicates top 10 enterprise apps receiving malware.
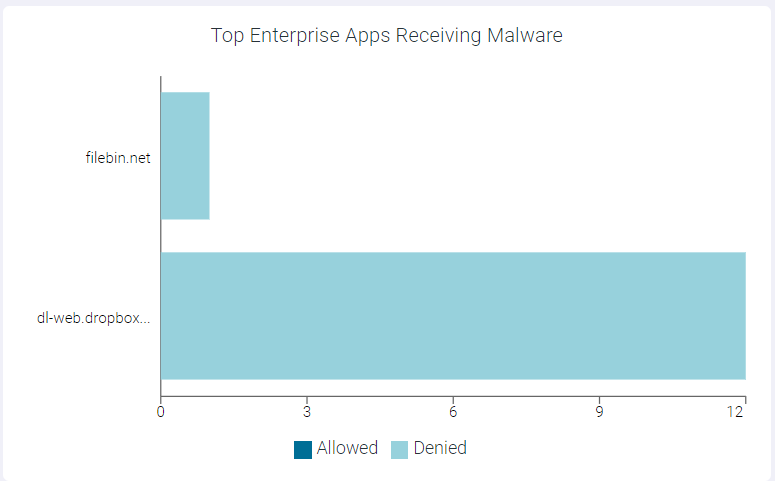
You can view Allowed or Denied data only by clicking the respective ledger at the bottom of the widget. Click the same ledger again to view the data for Allowed and Denied on the horizontal bar charts.
You can drill down the data at different levels:
- Drilling down the Apps by Group

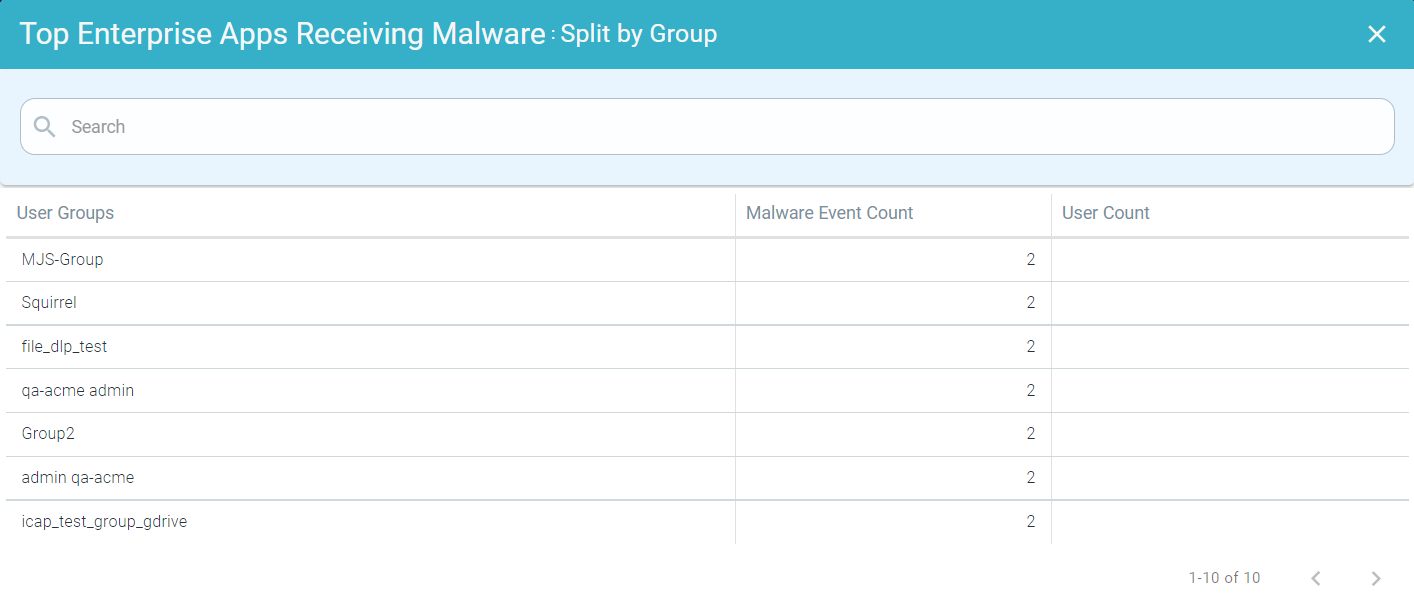
To drill down the apps by a group, click the name of the app and click Split by Group to open Top Enterprise Apps Receiving Malware : Split by Group page. This page displays modal table with User Groups, Malware Event Count and User Count fields.
- Drilling down the Apps by User

To drill down the apps by user, click the name of the application and click Split by User to open Top Enterprise Apps Receiving Malware : Split by User page. This page displays modal table with Username, Malware Event Count, and DLP Action fields.

- Drilling down the Allowed data of an App

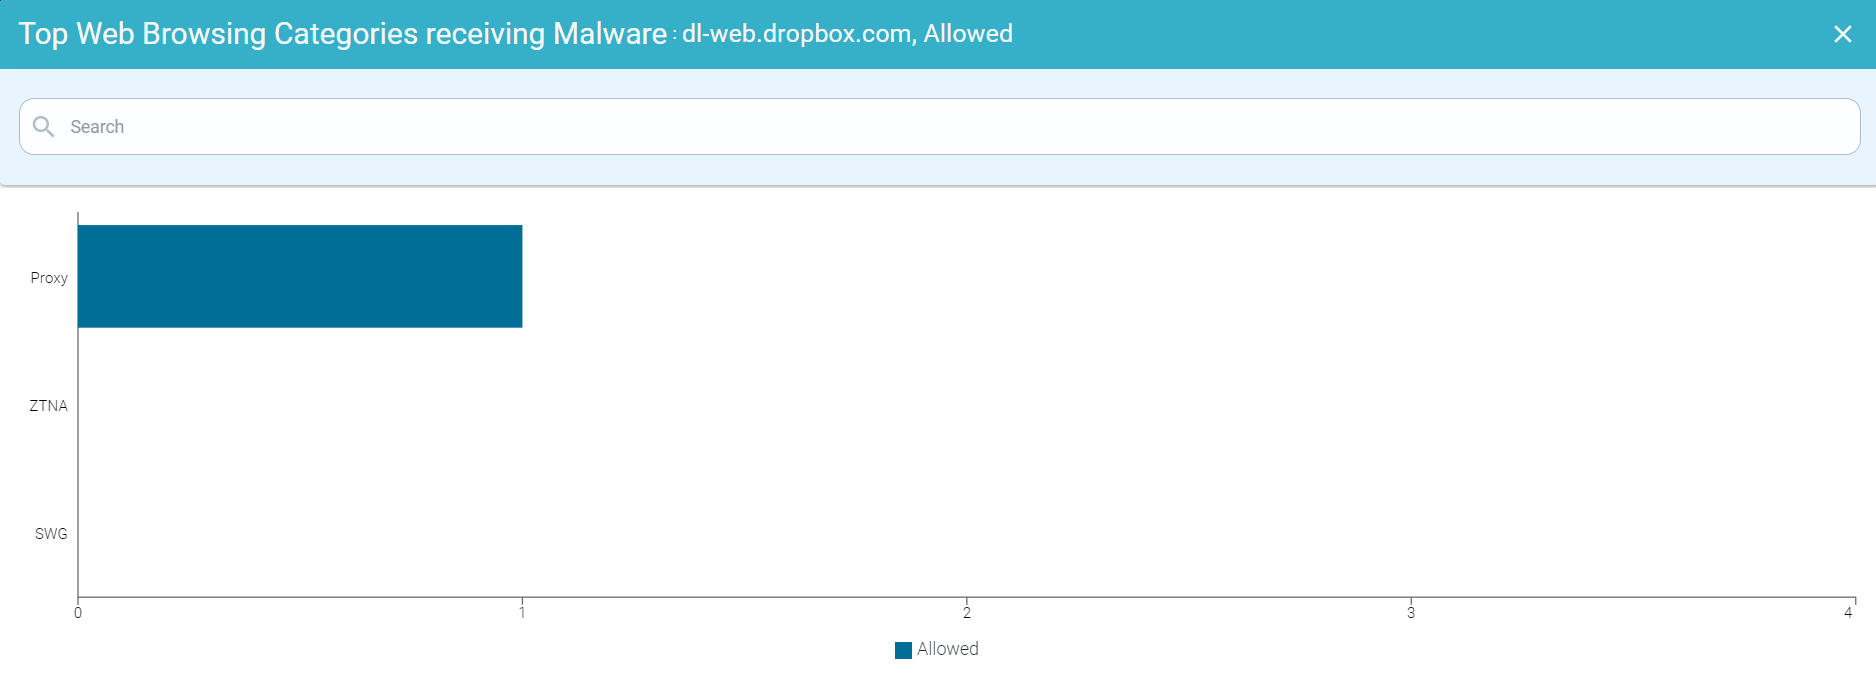
To drill down the allowed data of an application, click the Allowed split bar of an application and click Drill into <AppName>, allowed to open the Top Enterprise Apps Receiving Malware : <AppName>, allowed page. This page contains a horizontal bar chart with allowed Malware Event Count in the x-axis and SWG, Proxy and ZTNA bars in the y-axis.
- Drilling down the Denied data of an App

To drill down the denied data of an application, click the Denied split bar of an application and click Drill into <AppName>, denied to open the Top Enterprise Apps Receiving Malware : <AppName>, denied page. This page contains a horizontal bar chart with denied Malware Event Count in the x-axis and SWG, Proxy and ZTNA bars in the y-axis.
Malware Downloads
The Malware Downloads widget indicates number of times the files with malware was downloaded and download was denied to the applications. The Malware Downloads widget also displays total malware downloads analyzed.

- Allowed
You can drill down the Allowed logs by clicking the number below the Allowed to open the Malware Downloads : Allowed page. This page contains a horizontal bar chart with allowed Malware Event Count in the x-axis and SWG, Proxy and ZTNA bars in the y-axis.

You can further drill down the SWG malware downloads by clicking the SWG bar and then by clicking Drill into SWG to open the Malware Downloads : SWG page. This page contains a modal table with the Time, File Name, App Name, Domain and Username fields.
You can further drill down the Proxy malware downloads by clicking the Proxy bar and then by clicking Drill into Proxy to open the Malware Downloads : Proxy page. This page contains a modal table with the Time, File Name, App Name, Domain and Username fields.

You can further drill down the ZTNA malware downloads by clicking the ZTNA bar and then by clicking Drill into ZTNA to open the Malware Downloads : ZTNA page. This page contains a modal table with the Time, File Name, App Name, Domain and Username fields.
- Denied
You can drill down the Denied logs by clicking the number below the Denied to open the Malware Downloads : Denied page. This page contains a column chart with denied Malware Event Count in the x-axis and SWG, Proxy and ZTNA bars in the y-axis.

You can further drill down the SWG malware download denied data by clicking the SWG bar and then by clicking Drill into SWG to open the Malware Downloads : SWG page. This page contains a modal table with the Time, File Name, App Name, Domain and Username fields.
You can further drill down the Proxy malware download denied data by clicking the Proxy bar and then by clicking Drill into Proxy to open the Malware Downloads : Proxy page. This page contains a modal table with the Time, File Name, App Name, Domain and Username fields.
You can further drill down the ZTNA malware download denied data by clicking the ZTNA bar and then by clicking Drill into ZTNA to open the Malware Downloads : ZTNA page. This page contains a modal table with the Time, File Name, App Name, Domain and Username fields.
Top Groups Downloading Malware
The Top Groups Downloading Malware widget indicates top 10 groups downloading malware data.
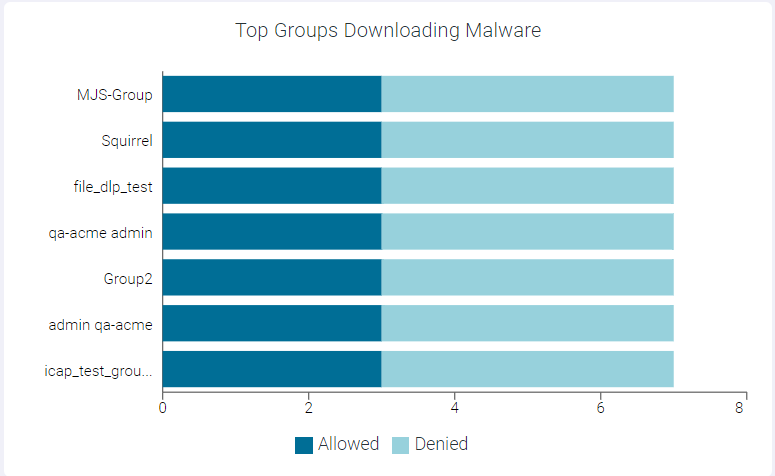
You can view Allowed or Denied data only by clicking the respective ledger at the bottom of the widget. Click the same ledger again to view the data for Allowed and Denied on the horizontal bar charts.
You can drill down the data at different levels:
- Drilling down at Group Level

To drill down at group level, click the name of the group and click Drill into <groupname> to open Top Groups Downloading Malware: <groupname> page. This page displays modal table with App Name, Domain, Malware Event Count, DLP Action and User Count fields.

- Drilling down the Allowed data of a Group
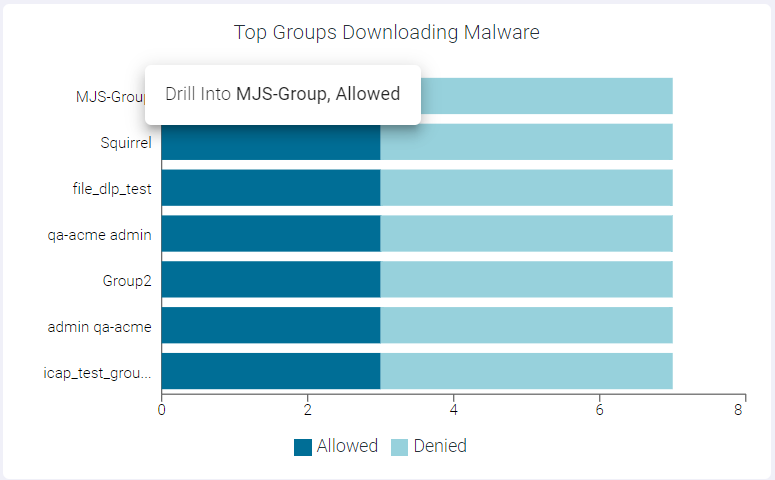
To drill down the allowed data of a group, click the Allowed split bar of the group and click Drill into <groupname>, allowed to open the Top Groups Downloading Malware : <groupname>, allowed page. This page displays modal table with App Name, Domain, Malware Event Count and Type fields.

- Drilling down the Denied data of a Group
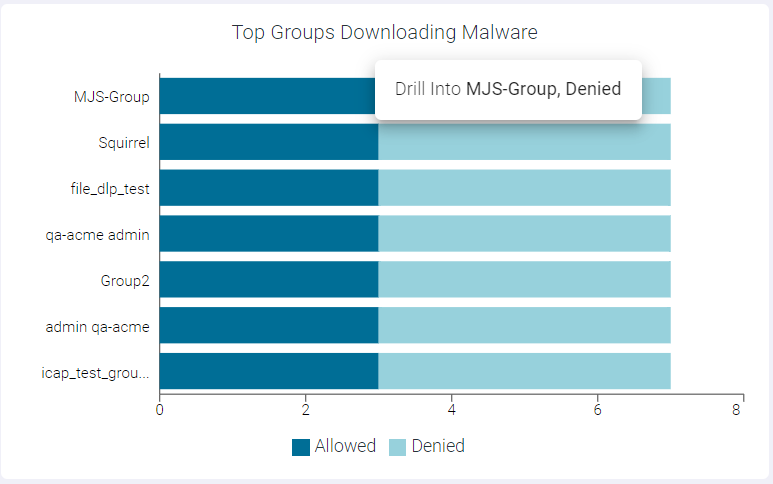
To drill down the denied data of a group, click the Denied split bar of the group and click Drill into <groupname>, denied to open the Top Groups Downloading Malware : <groupname>, denied page. This page displays modal table with App Name, Domain, Malware Event Count and Type fields.

Top Malware Downloaders
The Top Malware Downloaders widget indicates top 10 users downloading malware data.
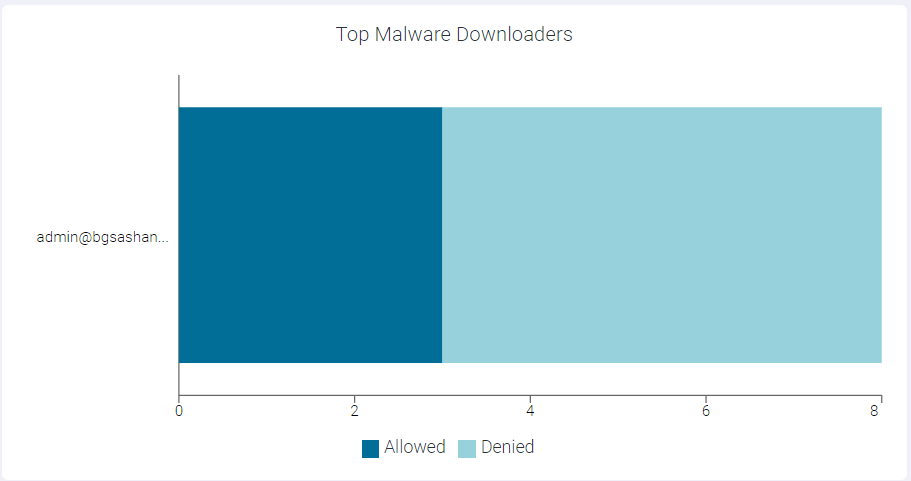
You can view Allowed or Denied data only by clicking the respective ledger at the bottom of the widget. Click the same ledger again to view the data for Allowed and Denied on the horizontal bar charts.
You can drill down the data at different levels:
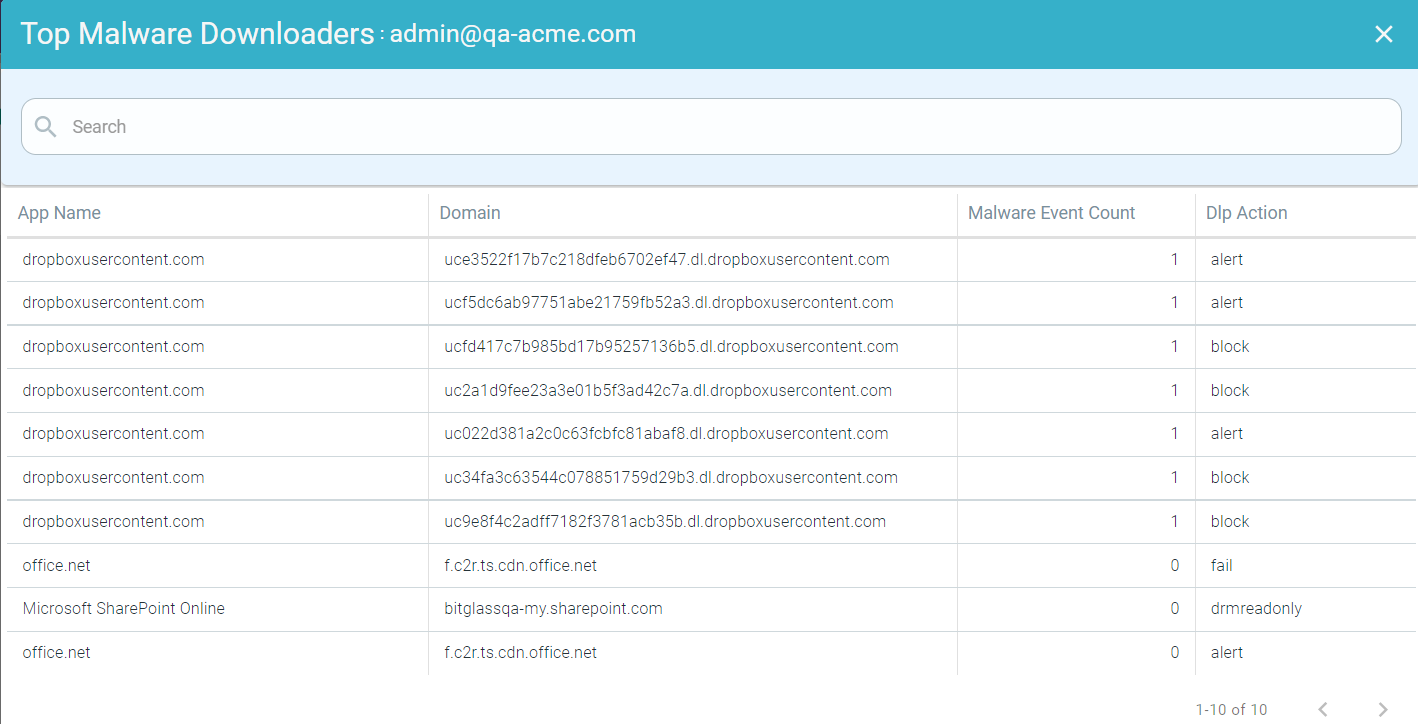
- Drilling down at User Level

To drill down at user level, click the name of the user and click Drill into <username> to open Top Malware Downloaders : <UserName> page. This page displays modal table with App Name, Domain, Malware Event Count, and DLP Action fields.
- Drilling down the Allowed data of a User

To drill down the allowed data of a user, click the Allowed split bar of a user and click Drill into <UserName>, allowed to open the Top Malware Downloaders : <UserName>, allowed page. This page displays modal table with App Name, Domain, Malware Event Count and Type fields.
- Drilling down the Denied data of a User
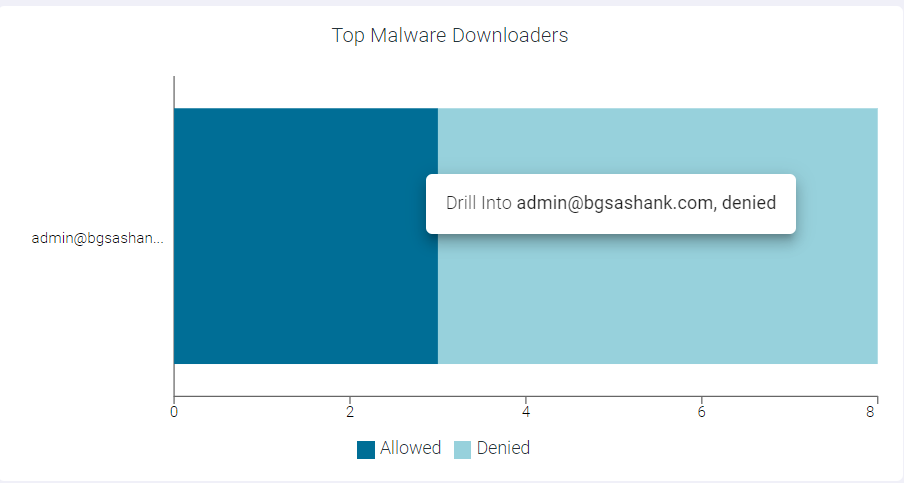
To drill down the denied data of a user, click the Denied split bar of a user and click Drill into <UserName>, denied to open the Top Malware Downloaders : <UserName>, denied page. This page displays modal table with App Name, Domain, Malware Event Count and Type fields.
Top Web Browsing Categories Sourcing Malware
The Top Web Browsing Categories Sourcing Malware widget indicates top 10 web browsing categories sourcing malware.
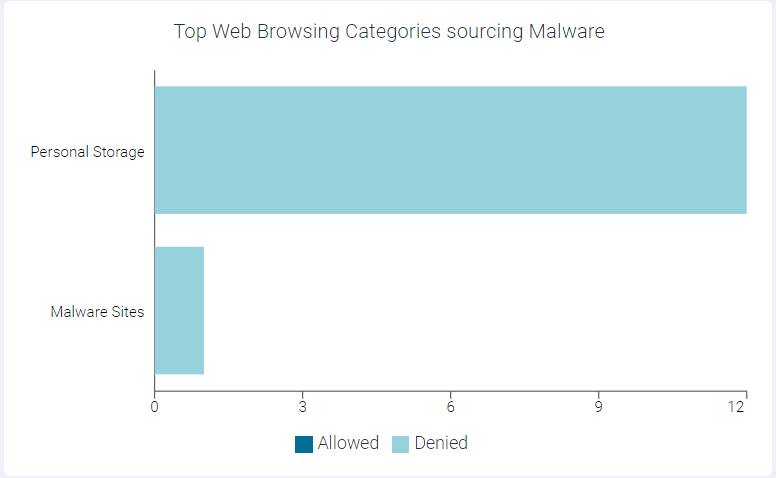
You can view Allowed or Denied data only by clicking the respective ledger at the bottom of the widget. Click the same ledger again to view the data for Allowed and Denied on the horizontal bar charts.
You can drill down the data at different levels:
- Drilling down the Malware by Web Browsing Category

To drill down at web browsing category level, click the name of the category and click Drill into <categoryname> to open Top Web Browsing Categories sourcing Malware : <categoryname> page. This page displays modal table with App Name, Domain, Malware Event Count and User Count fields.
- Drilling down the Allowed data of Web Browsing Category
To drill down the allowed data of the Web Browsing Category, click the Allowed split bar of the web browsing category and click Drill into <categoryname>, allowed to open the Top Web Browsing Categories sourcing Malware : <categoryName>, allowed page. This page contains a horizontal bar chart with allowed Malware Event Count in the x-axis and SWG, Proxy and ZTNA bars in the y-axis.
- Drilling down the Denied data of Web Browsing Category
To drill down the denied data of the Web Browsing Category, click the Denied split bar of the web browsing category and click Drill into <categoryname>, denied to open the Top Web Browsing Categories sourcing Malware : <categoryname>, denied page. This page contains a horizontal bar chart with denied Malware Event Count in the x-axis and SWG, Proxy and ZTNA bars in the y-axis.
Top Enterprise Apps Sourcing Malware
The Top Enterprise Apps Sourcing Malware widget indicates top 10 enterprise apps sourcing malware.
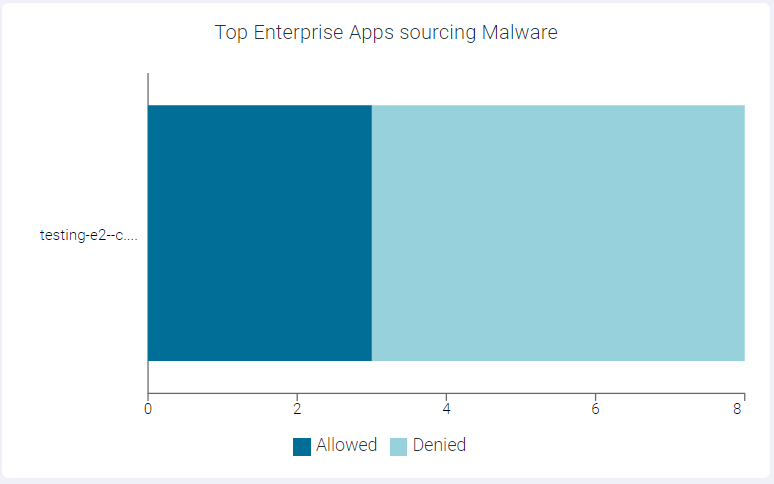
You can view Allowed or Denied data only by clicking the respective ledger at the bottom of the widget. Click the same ledger again to view the data for Allowed and Denied on the horizontal bar charts.
You can drill down the data at different levels:
- Drilling down the Apps by Group

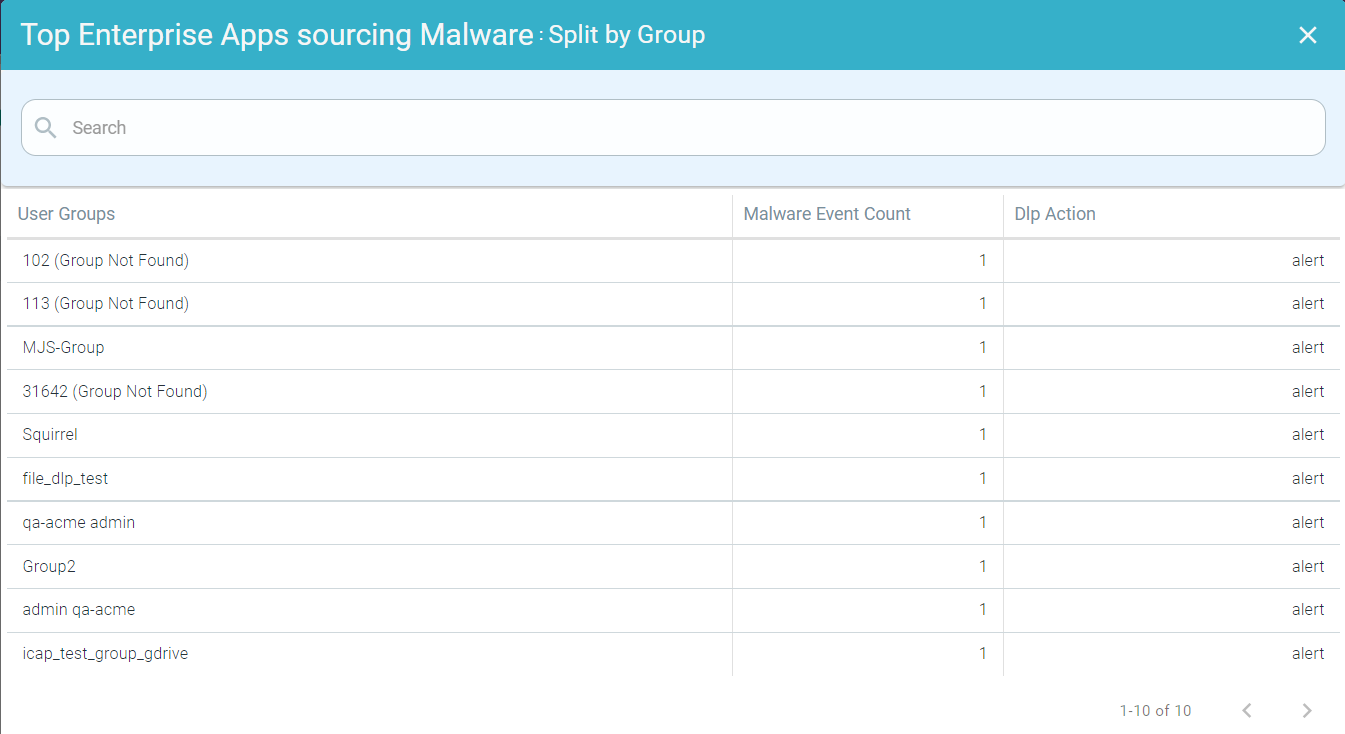
To drill down the apps by a group, click the name of the app and click Split by Group to open Top Enterprise Apps Sourcing Malware : Split by Group page. This page displays modal table with User Groups, Malware Event Count and DLP Action fields.
- Drilling down the Apps by User

To drill down the apps by user, click the name of the application and click Split by User to open Top Enterprise Apps Sourcing Malware : Split by User page. This page displays modal table with Username, Malware Event Count and DLP Action fields.

- Drilling down the Allowed data of an App

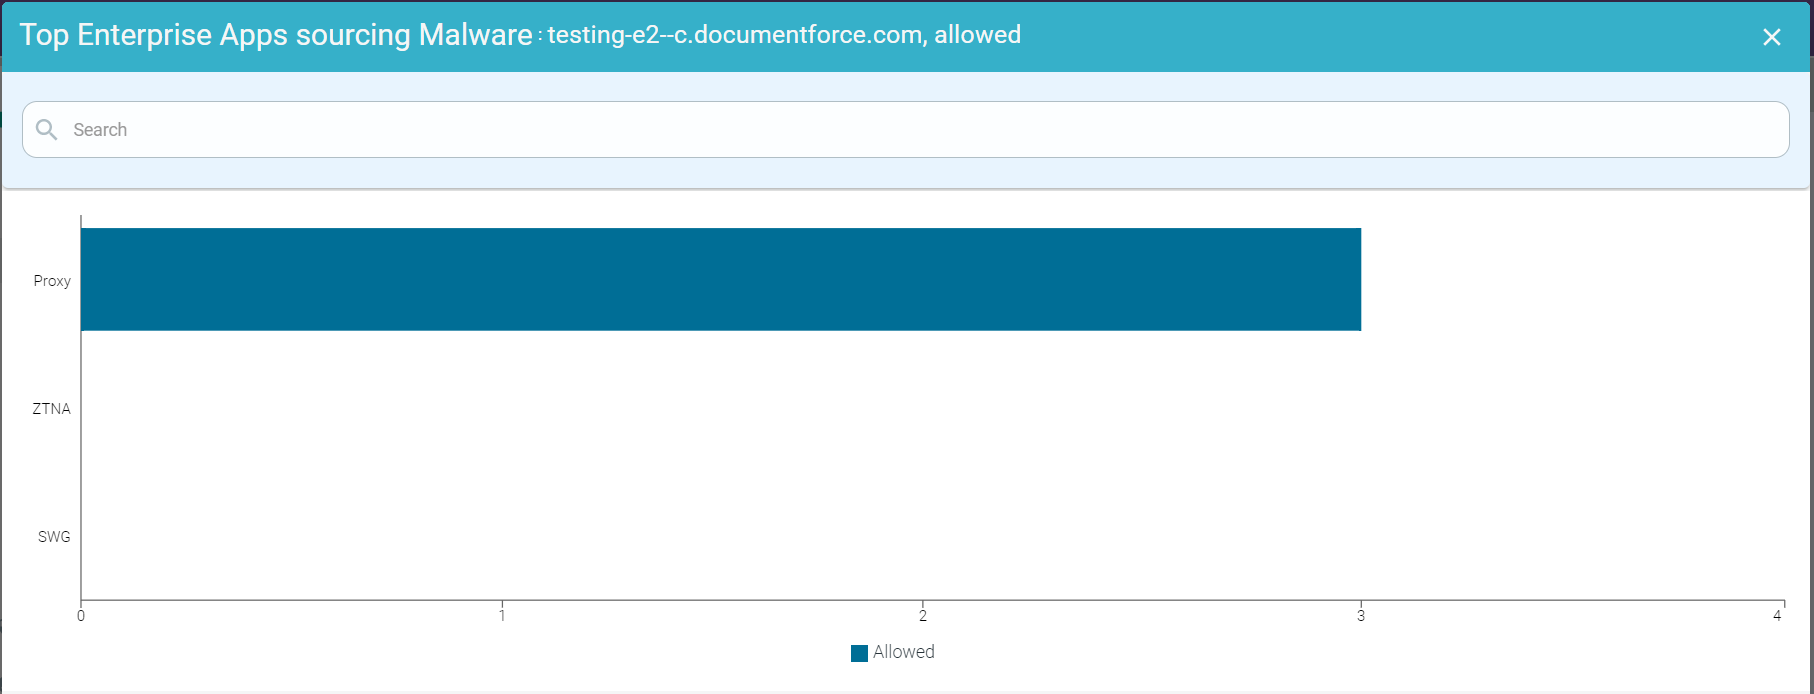
To drill down the allowed data of an application, click the Allowed split bar of an application and click Drill into <AppName>, allowed to open the Top Enterprise Apps Sourcing Malware : <AppName>, allowed page. This page contains a horizontal bar chart with allowed Malware Event Count in the x-axis and SWG, Proxy and ZTNA bars in the y-axis.
- Drilling down the Denied data of an App

To drill down the denied data of an application, click the Denied split bar of an application and click Drill into <AppName>, denied to open the Top Enterprise Apps Sourcing Malware : <AppName>, denied page. This page contains a horizontal bar chart with denied Malware Event Count in the x-axis and SWG, Proxy and ZTNA bars in the y-axis.