Understanding CSPM dashboard
When you first navigate to you will land on the homepage that displays the list of reports generated that you can click on and view.
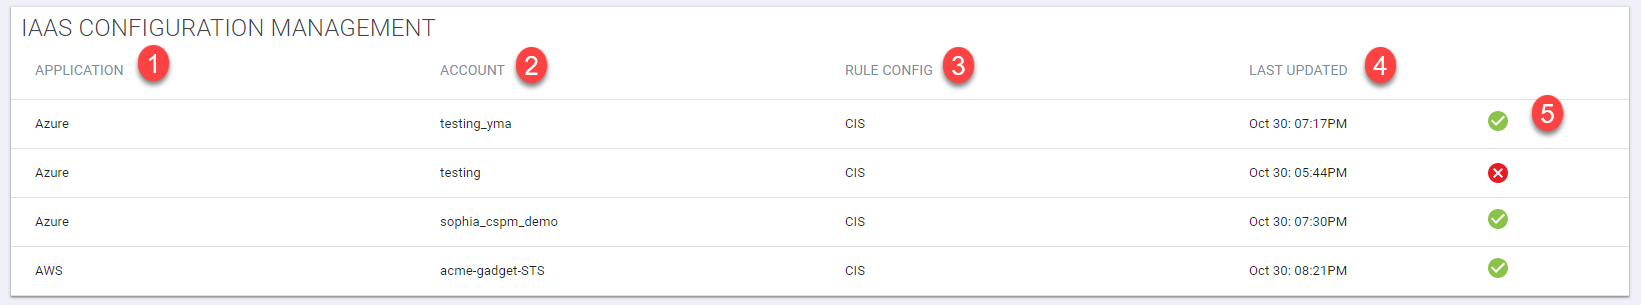
- Application: Displays which IaaS application the report was generated for. Currently Forcepoint Data Security Cloud | SSE supports AWS and Azure with GCP on the roadmap.
- Account: Lists the admin user account or token service being used for the scan.
- Rule Config: Lists the benchmark rule configuration that the scan was checking against, in this case the CIS Benchmark.
- Last Updated: Displays the date that the report was last generated from the audit scan.
- A green check mark or a red X indicates whether the scan was successful or if it failed. If the scan failed, no report will have been generated.