Home
The Home page provides a visually intuitive, data-driven dashboard that consolidates critical SaaS data discovery metrics, including Summary and Activity Log, along with quick access to key product updates.
This is the default home page view. However, for users who log in and configure Forcepoint Data Security Cloud | SSE for the first time, clicking the Don't Show Again button under the Getting Started with CASB widget will take you to the default home page.
- 1
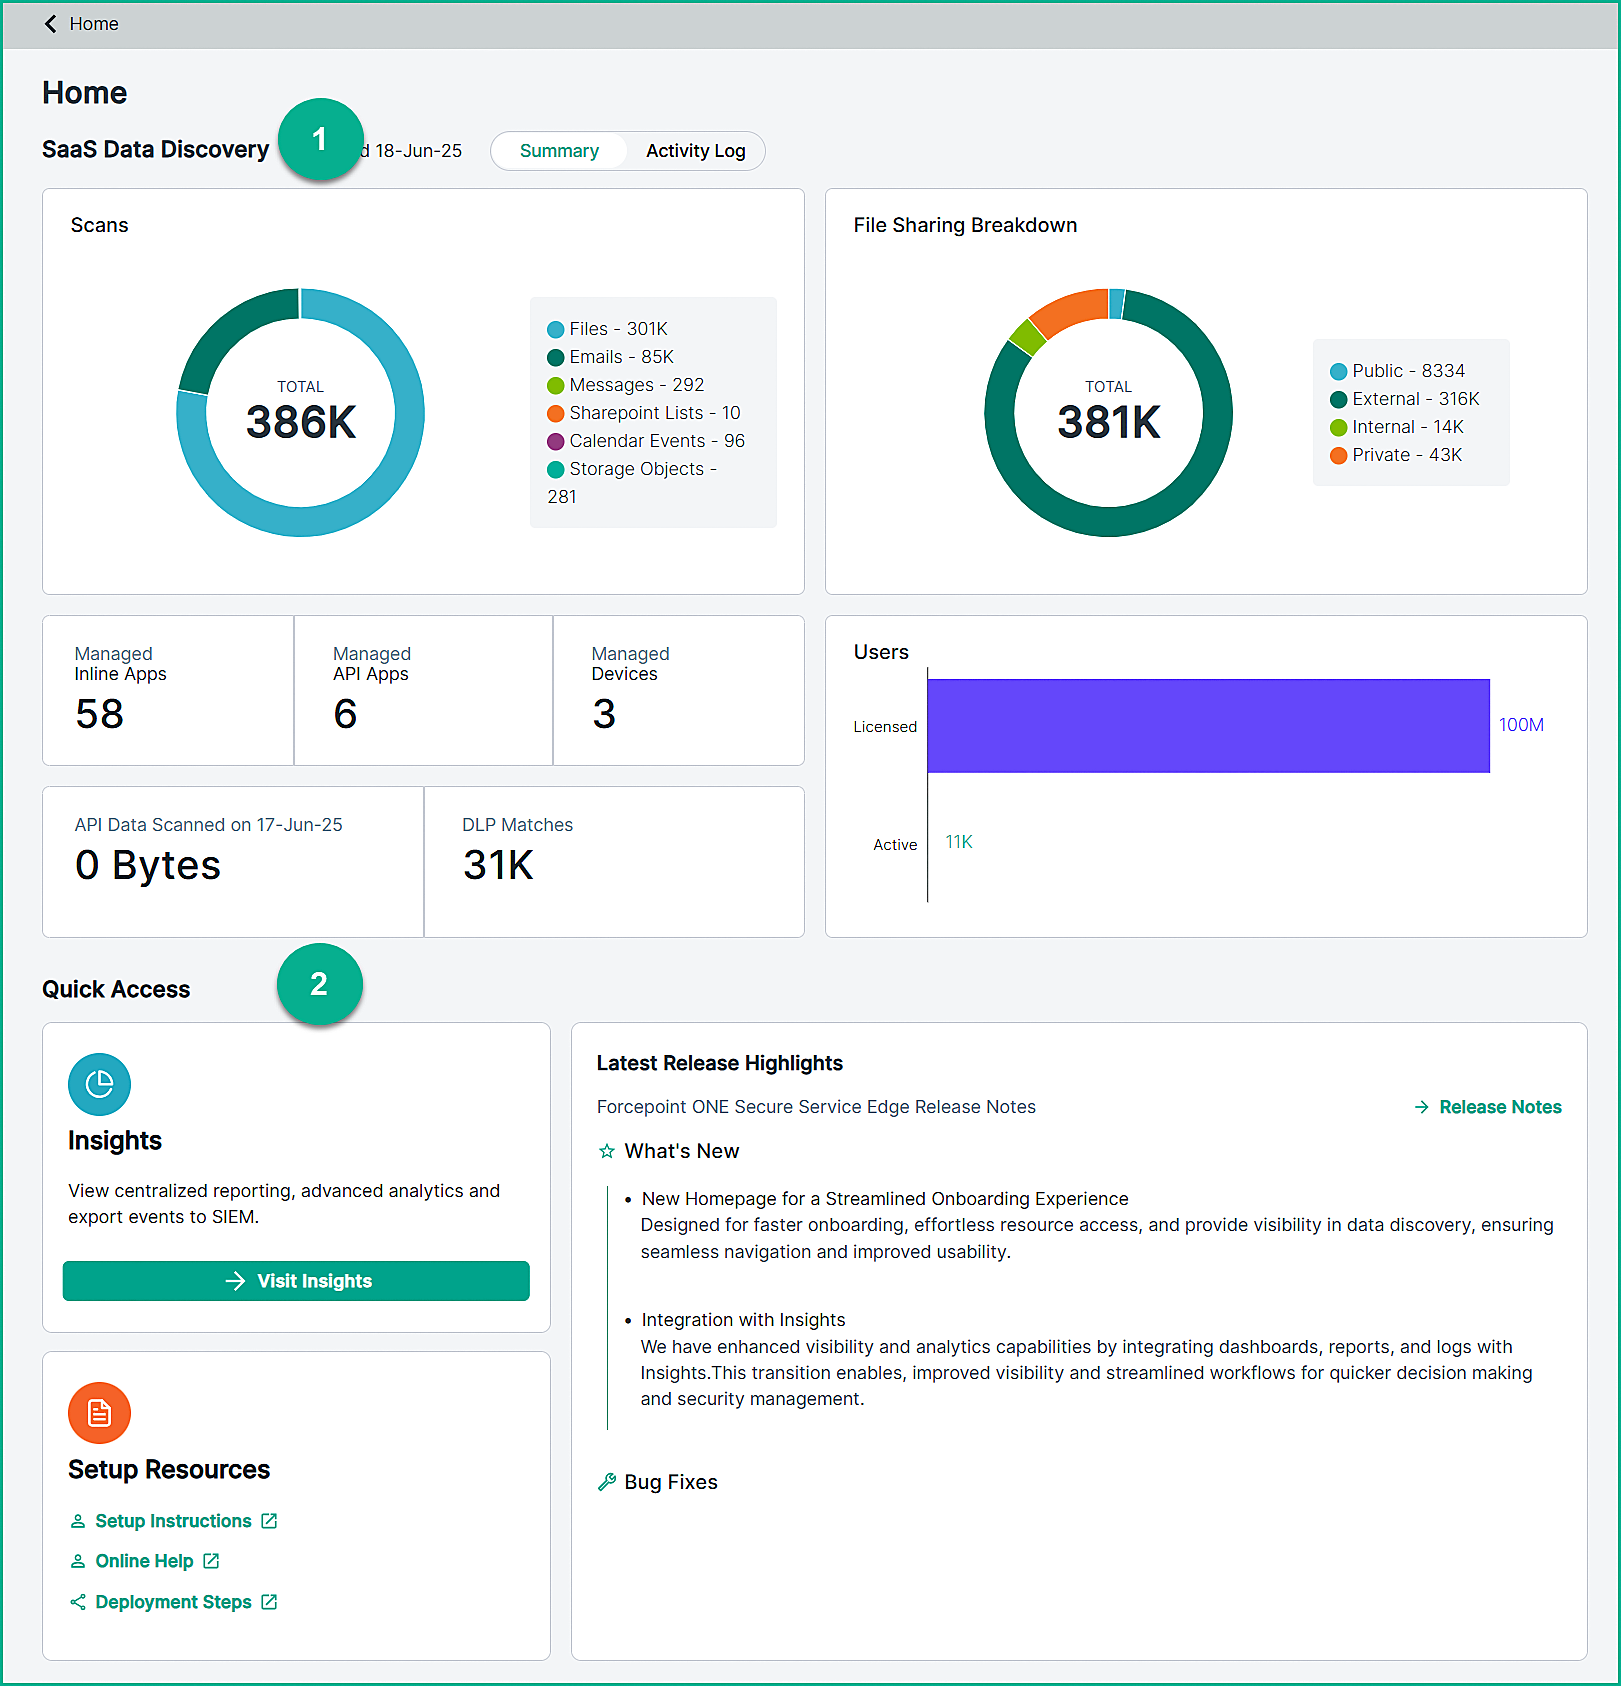
- SaaS Data Discovery: This section contains the CASB API summary and activity logs.
- On the Summary tab, you can view visually intuitive, data-driven dashboard that consolidates critical SaaS data discovery metrics.
- Scans: Displays total number of scans performed for the tenant up to the timestamps shown in the Last Updated field. This title also
displays a breakdown of scans for the following categories:
- Files
- Emails
- Messages
- SharePoint Lists
- Calendar Events
- Storage Objects
- AI Messages
- File Sharing Breakdown: Displays total count of shared files along with categorized breakdown of file sharing.
- Private: Files that are not shared with anyone.
- Internal: Files shared with individuals internal to the organization.
- External: Files shared with specific individuals outside the corporate domain but within the application vendor's domain are considered external. For example, sharing from your corporate Gmail account to a personal Gmail account.
- Public: Files shared by creating shareable links that do not require user authentication, as well as files shared with users outside the application vendor's domain, are considered public. For example, sharing from your corporate Gmail account to personal OneDrive account.
- Managed Inline Apps: Displays the total count of managed inline applications with real-time traffic monitoring and policy enforcement by CASB.
- Managed API Apps: Displays the total count of managed API applications monitored and controlled via API integration with CASB.
- Managed Devices: Displays the total count of managed devices accessing cloud applications, with visibility and control enforced by the CASB.
- API Data Scanned: Displays the total volume of API data scanned.
- DLP Matches: Displays the total number of DLP matches, providing an accurate assessment of the potential data loss incidents.
- Users: Displays the number of licensed and active users.
- Scans: Displays total number of scans performed for the tenant up to the timestamps shown in the Last Updated field. This title also
displays a breakdown of scans for the following categories:
- On the Activity Logs tab, you can view and filter activity logs for SaaS applications, allowing you to monitor file access, ownership, and status for security
and compliance purposes.
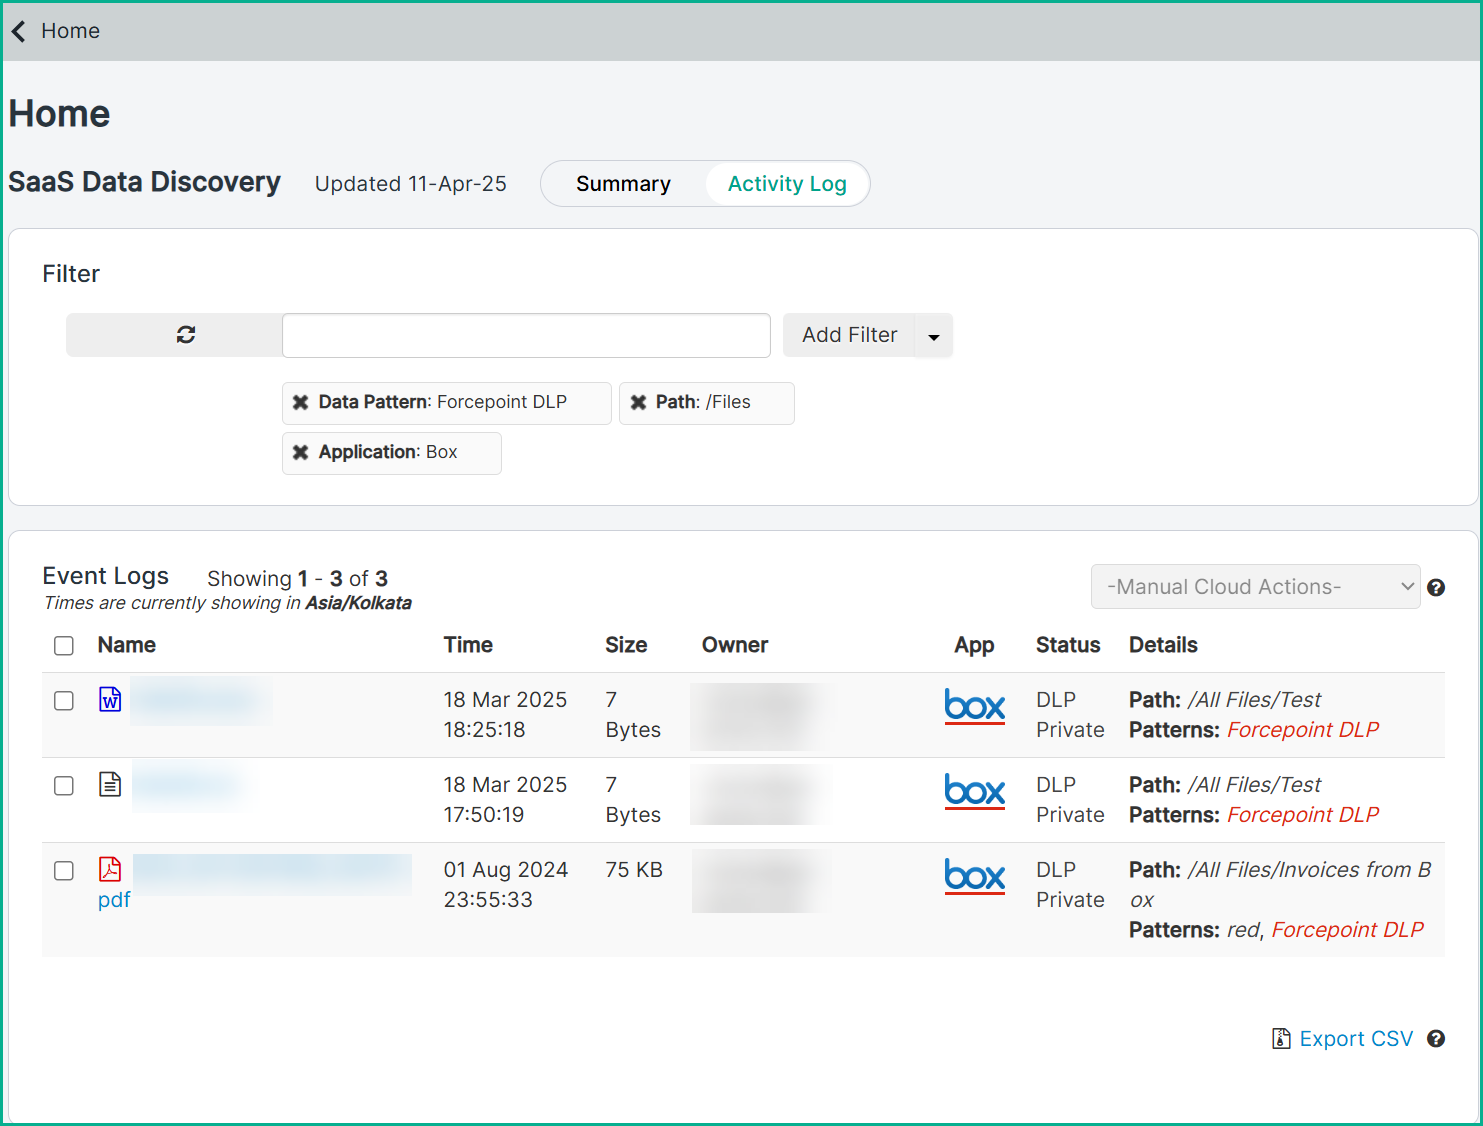
- Filter: Apply filters to filters logs.
To learn how to apply filters, refer to Filtering logs in the activity log tab.
- Manual Cloud Actions: In addition to triggered cloud policy actions, Forcepoint Data Security Cloud | SSE allows admins to apply manual cloud
actions to files.
To learn about manual cloud actions, refer to Applying manual cloud action in API logs.
- Name: Displays file name. Click the name to view its details.
To understand log details, refer to Understanding log details.
- Time: Displays time of the event.
- Size: Displays size of the file.
- Owner: Displays the owner of the file's account name.
- App: Displays the application associated with the event.
- Status: Displays the status of the file associated with the event.
- Details: Displays log details, such as path of the file, data pattern applied, users with files shared with and so on.
- Export CSV: Click Export CSV to download the logs based on the filtered applied for further analysis.
To learn about exporting logs, refer to Exporting logs.
- Filter: Apply filters to filters logs.
- On the Summary tab, you can view visually intuitive, data-driven dashboard that consolidates critical SaaS data discovery metrics.
- 2
- Quick Access: The Quick Access section in the Summary tab displays links to Insights, resources, and release notes.
- Insights: Click the Visit Insights link under the Insights title to access CASB Insights dashboards and reports,
allowing you to monitor security events and export them to SIEM.
To learn about how to access dashboards and reports from Insights, see the Accessing Dashboards and Reports page.
- Resources: Provides essential deployment and admin guide links, allowing you to quickly access relevant documentation to configure and manage the CASB solution.
- Latest Release Highlight: The Latest Release Highlight displays an overview of the most recent updates, features, and enhancements,
showcasing key improvements and new functionalities in the latest release.
Also includes a link to access the complete release notes for detailed information.
- Insights: Click the Visit Insights link under the Insights title to access CASB Insights dashboards and reports,
allowing you to monitor security events and export them to SIEM.