SSE SWG Dashboard
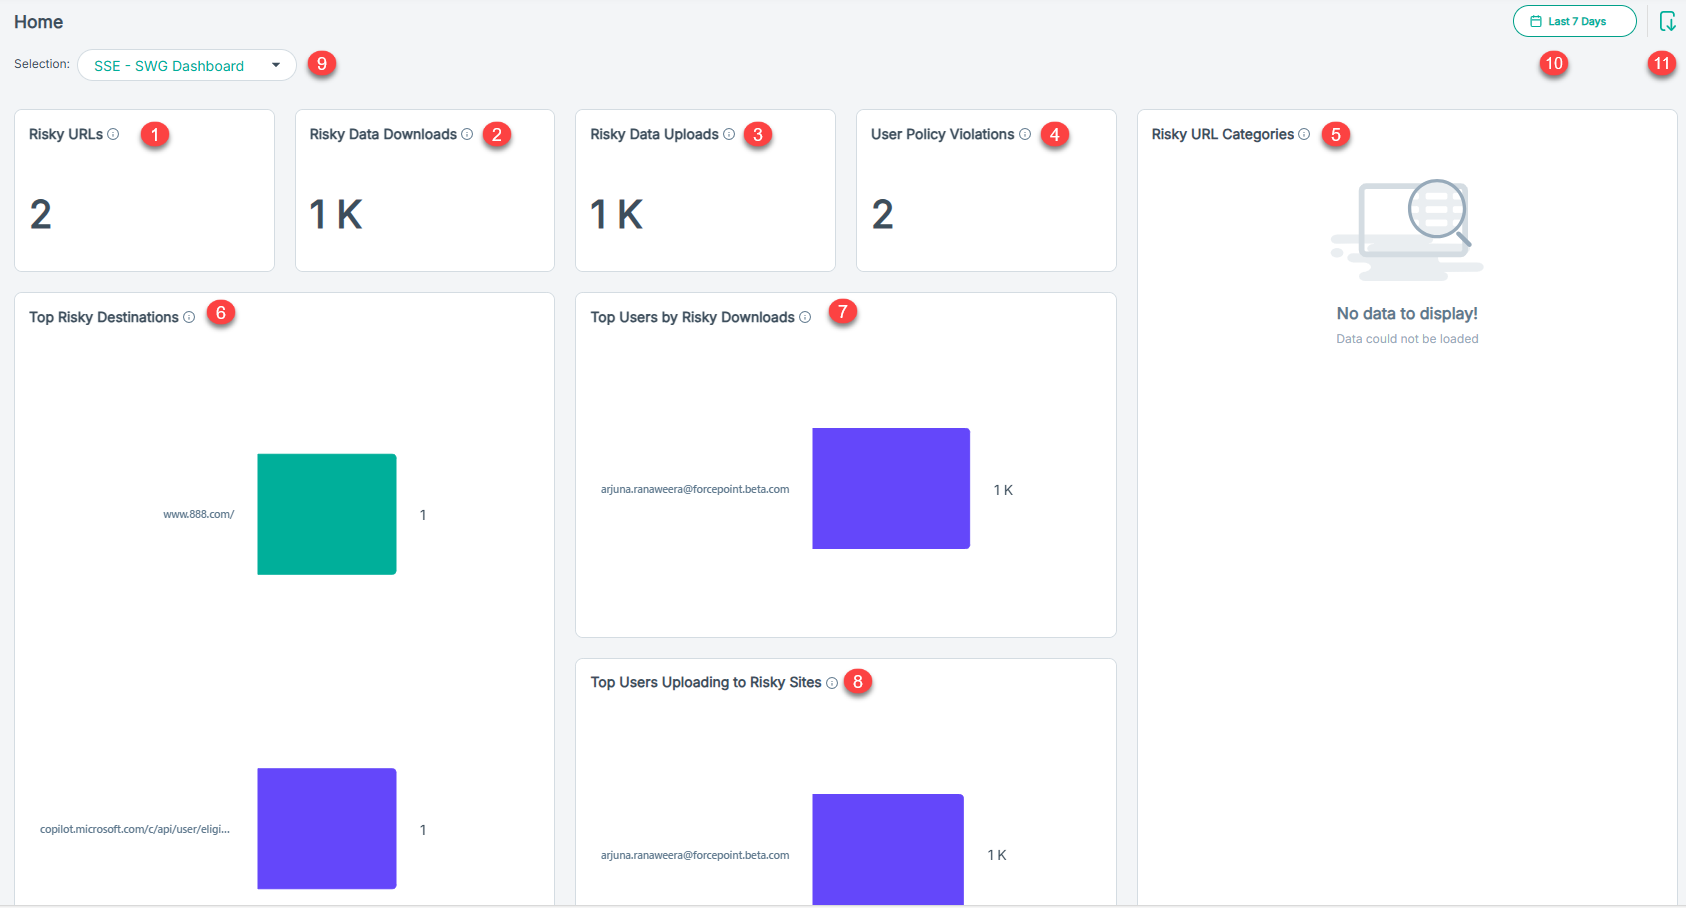
The SSE SWG Dashboard provides an overview of your users' web browsing usage, segmented by different URL destinations and their individual URL reputations, for the selected time range.
This dashboard is configured to provide a high-level overview of the top items admins will want to review. Admins can access the dashboard by navigating to and selecting the SSE SWG Dashboard from the drop-down.
- 1
- Risky URLs: Unique destination URL's classified as harmful and suspicious.
- 2
- Risky Data Downloads: Total volume or amount of data downloaded from destinations classified as harmful and suspicious.
- 3
- Risky Data Uploads: Total volume or amount of data uploaded from destinations classified as harmful and suspicious.
- 4
- User Policy Violations: Users who have violated security or compliance policies.
- 5
- Risky URL Categories: Shows which types of risky contents are accessed most and by how many users.
- 6
- Top Risky Destinations: Top 10 destinations classified as harmful and suspicious.
- 7
- Top Users by Risky Downloads: Top 10 users by volume of data downloaded from sites classified as suspicious or harmful.
- 8
- Top Users Uploading to Risky Sites: Top 10 users who uploaded the highest volumes of data to destinations classified as harmful or suspicious.
- 9
- Selection: Allows to select the Pre-Defined dashboards.
- 10
- Filter based on Time period: Allows to filter data on the selected Time period.
- 11
- Export: You can export any of the Pre-Defined dashboards as a PDF file.