Dashboard
The dashboard displays a summary of service activity over time.
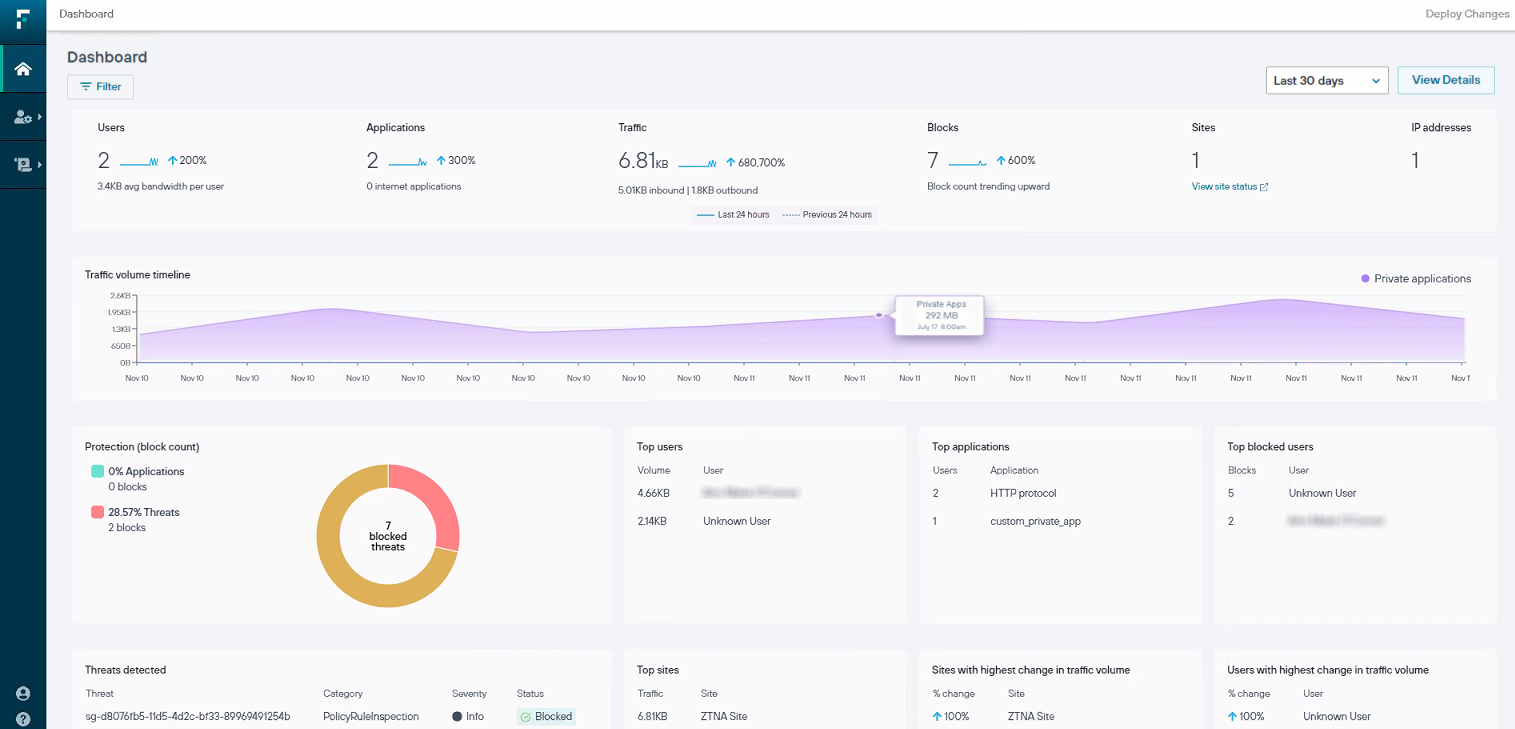
Click Filter to select the data that is displayed on the dashboard.
Use the time period drop-down menu to change the reporting period to the last 24 hours, 7 days, or 30 days. By default, data is displayed for all Private Access traffic, for the past 1 hour.
Click View Details to view detailed log information for the information displayed.
| Panel | Description |
|---|---|
| Users | Total number of active users of the service, and average bandwidth usage. |
| Applications | Total number of applications that have been accessed through the service. |
| Traffic | Total amount of inbound and outbound traffic routed through the service. |
| Blocks | Total number of access attempts that were blocked. |
| Sites | Total number of active sites/hosting locations. |
| IP addresses | Total number of unique IP addresses that attempted to access resources through the service. |
| Panel | Description |
|---|---|
| Protection (block count) | A pie chart showing the percentage of blocked requests, per category.
|
| Top users | Total traffic (inbound and outbound) per user or client IP address. |
| Top applications | Total traffic (inbound and outbound) per private application. |
| Top blocked users | Total number of blocked requests per user. |
| Most recent blocked threats | Details of the last 5 blocked threats:
|
| Top sites | Total traffic volume (inbound and outbound) per site. |
| Sites with highest change in traffic volume | The sites that have experienced the greatest variation in traffic volume, compared to the last comparable reporting period. |
| Users with highest change in traffic volume | The users that have experienced the greatest variation in traffic volume, compared to the last comparable reporting period. |