Using reporting tools
Forcepoint Web Security Cloud provides exceptional reporting functionality with a 360-degree view of web traffic and usage. Administrators can view pre-defined summary reports, drill down for detailed forensics, and create granular, customized reports using an intuitive drag and drop interface.
To define your own reports, navigate to , then select Web Security (for all web activity) or Data Security (for activity associated with data loss or data theft incidents).
In Report Builder, use the attributes and metrics in the left pane to generate multi- level, flexible reports that allow you to analyze information from different perspectives and gain insight into your organization’s Internet usage.
Once you have selected the attributes and metrics to display, you can add filters for the report such as policies, users, or domains, and also define a date range.
When you run your report, you can drill down into the report data by clicking any item top open the Transaction Viewer (for general web activity) or the Incident Manager (for data security incidents). Here, you can access all available details about individual transactions or incidents that warrant further investigation.
To select from a list of predefined reports, navigate to .
Below is an example of a volumes report showing the requests for the most frequently visited categories per day, over a 7-day period.
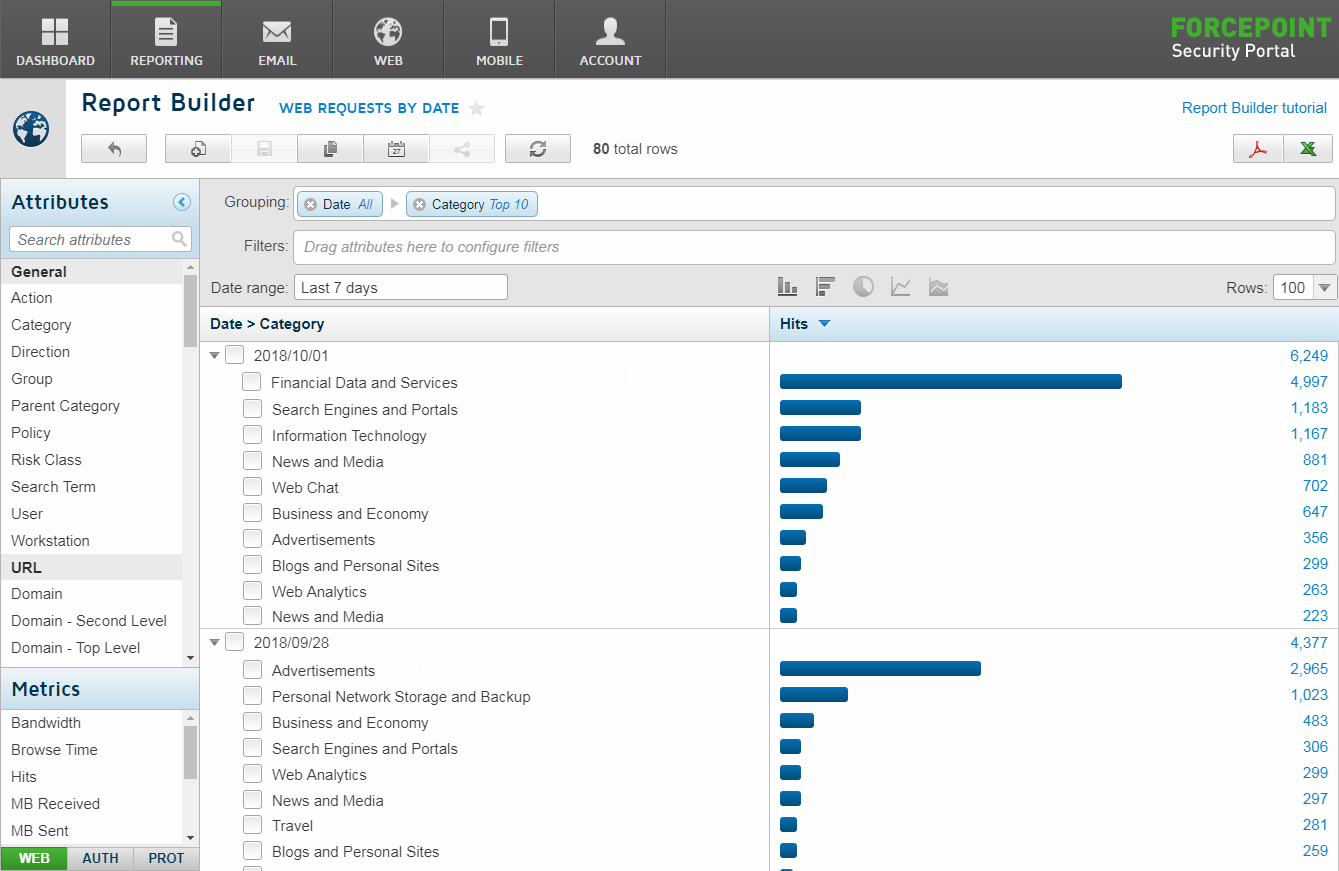
Click a bar in the chart to drill down further and see details of all requests in each category. You can add further attributes to examine the data by users, group, site, policy, or any other relevant attribute. You can save a report, or export it to PDF or CSV.
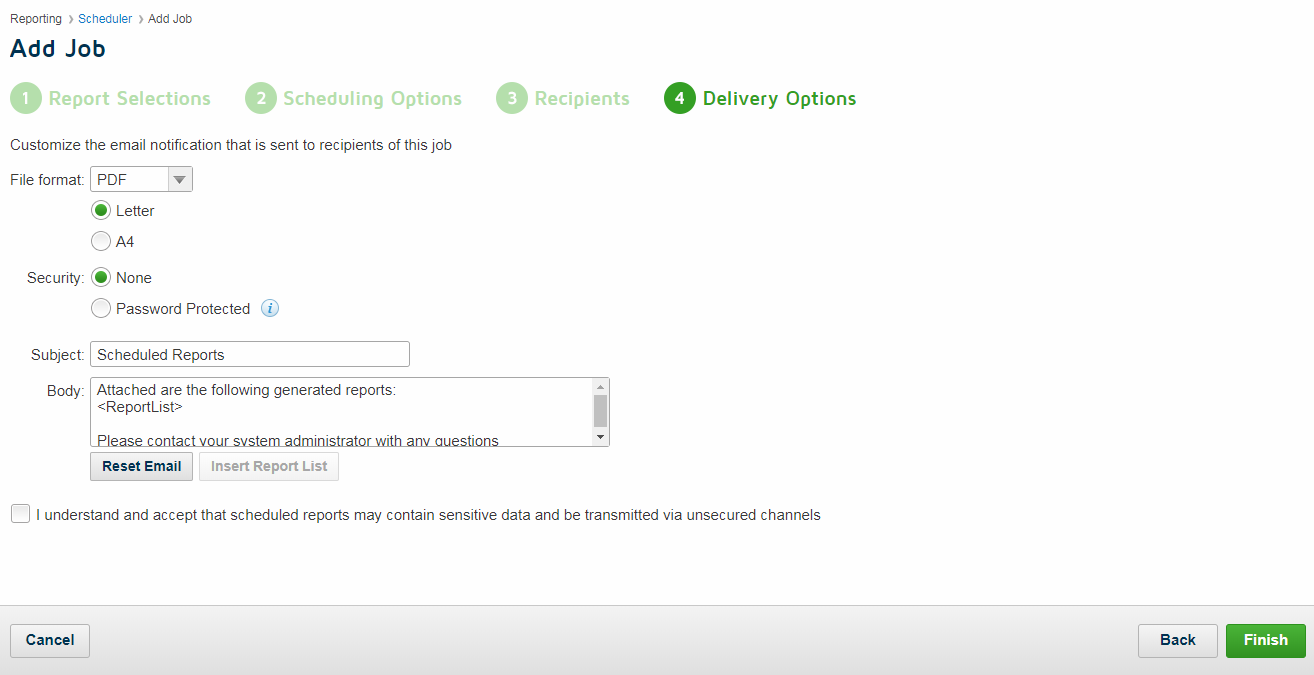
Using the report scheduler, you can also schedule saved reports to run automatically and be distributed to your contacts via email.
For more information on the reporting tools available in the cloud portal, see Report Center in the Forcepoint Web Security Cloud help.