Using cloud portal dashboards
The dashboard provides a snapshot view of Forcepoint Web Security Cloud activity. To view your dashboard, click Dashboard on the cloud portal main menu bar.
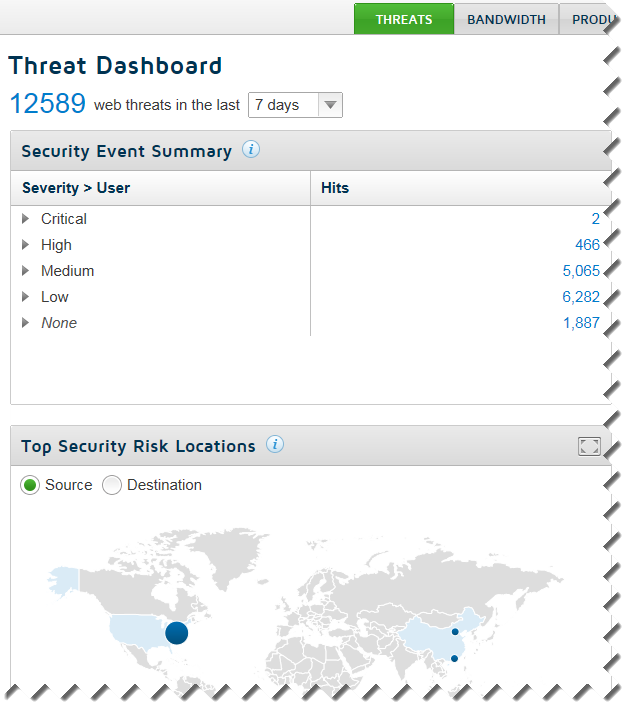
- The Threat Dashboard appears when you first access this page. It shows information about suspicious activity that may be related to malware threats in your network.
- The Bandwidth Dashboard shows information about traffic patterns in your network, including the categories, groups, and users consuming the most bandwidth.
- The Productivity Dashboard shows information about blocked requests, and activity in social media categories.
- The Cloud Apps Dashboard shows information about cloud app usage, by category and risk level.
- The Data Security Dashboard shows information about data loss and data threat incidents, including a timeline, incidents by content type, and top sources, destinations, and categories associated with incidents. See Configuring Data Security settings.
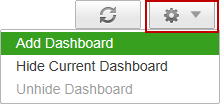
In addition to the predefined dashboards, you have the option to add up to 10 custom dashboards. To add a dashboard, click the Settings icon on any dashboard page, then click Add Dashboard.
Provide a name for the new dashboard, then use the Settings menu to populate your custom dashboard with up to 6 charts. You can either define new charts by selecting attributes, or use an existing report as the basis for creating new charts.
Each dashboard includes the following features:
- A number of charts that provide detailed web activity information. Most dashboard charts can be customized to change their display format (for example stacked column, area chart, line chart, bar chart, or pie chart).
- A summary statistic in the top left that covers web activity relevant to the current dashboard over a defined time period (the last day by default). You can select a different time period from the drop-down list: the alternative options are 1 hour, 4 hours, 8 hours, 12 hours, 3 days, 5 days, and 7 days.
- One or more filters that define the range of content shown in the charts.