Customize summary reports
In addition to drilling down into data to find details of interest, you can customize the information that appears in investigative reports in a number of ways. In a summary report, you can, for example:
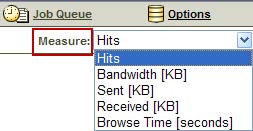
- Change the measuring unit from the default hits (or visits, depending on which your environment is configured to record) to bandwidth (in kilobytes), KB sent, KB
received, or seconds of browse time.

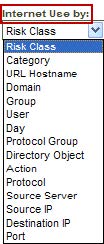
- Change the data grouping from the default risk class to category, URL hostname, domain, group, user, day, protocol group, directory object, action, protocol, source server IP
address, source IP address, destination IP address, or port. For more information about these options, see What information can I see in a report?.

- Change the time period from the default one day to a standard period (week, month, or all) or specific date range.

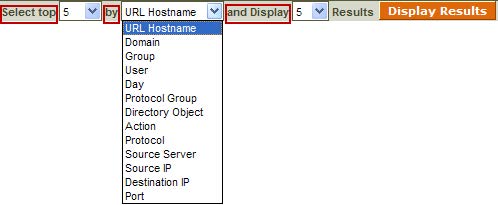
- Combine a high-level summary with an overview of details by creating a top N report. While looking at the default summary of requests by risk class, you might add additional detail by
also displaying the top 5 sites (URL hostnames) requested in all 5 risk classes. For more information about the options in the “by” list, see What information can I see in a
report?.
