What the Security Engine home pages show
Home pages show different information depending on the type of element.
Click the status card of an element or select the element in the Status tree to open the home page for the element.
To edit the layout of the element home pages, click ![]() Edit at the top right corner of the view. You can re-size panes, or drag new panes
into the view. To remove a pane, drag the pane to the top of the view.
Edit at the top right corner of the view. You can re-size panes, or drag new panes
into the view. To remove a pane, drag the pane to the top of the view.
Figure: Security Engine home page
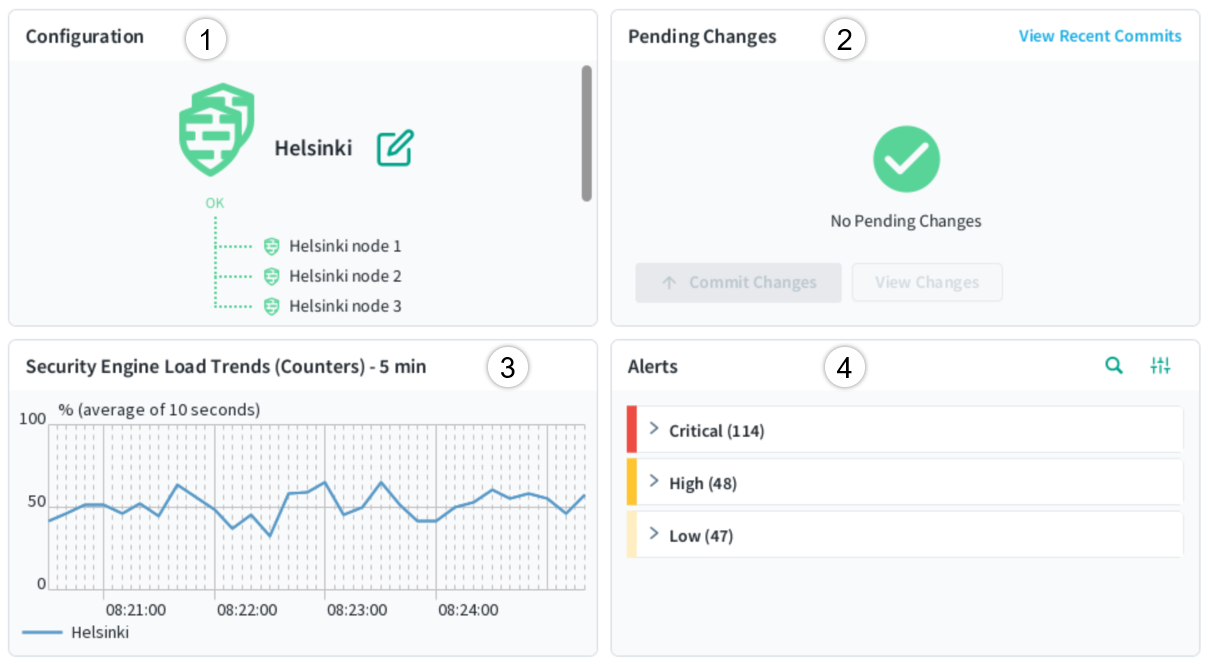
- 1
- Shows information about the configuration status and the VPN branch status of the Security Engine.
- To view detailed information about the VPN branch associated with the Security Engine, click the branch name. To preview the Security Engine properties or the policy, click the Security Engine or policy name. To edit the
properties or the policy, click
 Edit.
Edit. - 2
- The Pending Changes pane shows configuration and policy changes that have not yet been transferred to the Security Engines. Provides options for viewing, approving, and committing pending changes. The Recent Commits pane shows recent policy uploads. It opens in the same place as the Pending Changes pane.
- 3
- Shows how the traffic load on the Security Engine has changed over time.
- 4
- Shows active alerts for the Security Engine. The More actions menu allows you to organize alerts according to the severity or situation type.
When you select an individual Security Engine node in the Status tree, the hardware diagram page opens, showing details about the status of network ports. More detailed information is shown in the Info pane for network interfaces and hardware (appliance) status.
Engine Status History
The Security Engine the status history view by engine shows status changes over time, and engine specific traffic trends and top bandwidth network applications.
-
On Dashboard view, right click any of the Security Engines, and select .
By selecting, different time periods, view the Security Engine statuses over the selected period.