Understanding Discover page in Discovery Report
The Discovery page provides a summary overview of your user's ShadowIT usage.
It includes a breakdown of total events and number of applications accessed broken down by trust rating. This allows admins to quickly review the riskiest activity within their network at a quick glance. The page is divided into three sections, Cloud Risk Assessment summary box, summary graphs, and volume bar chart.
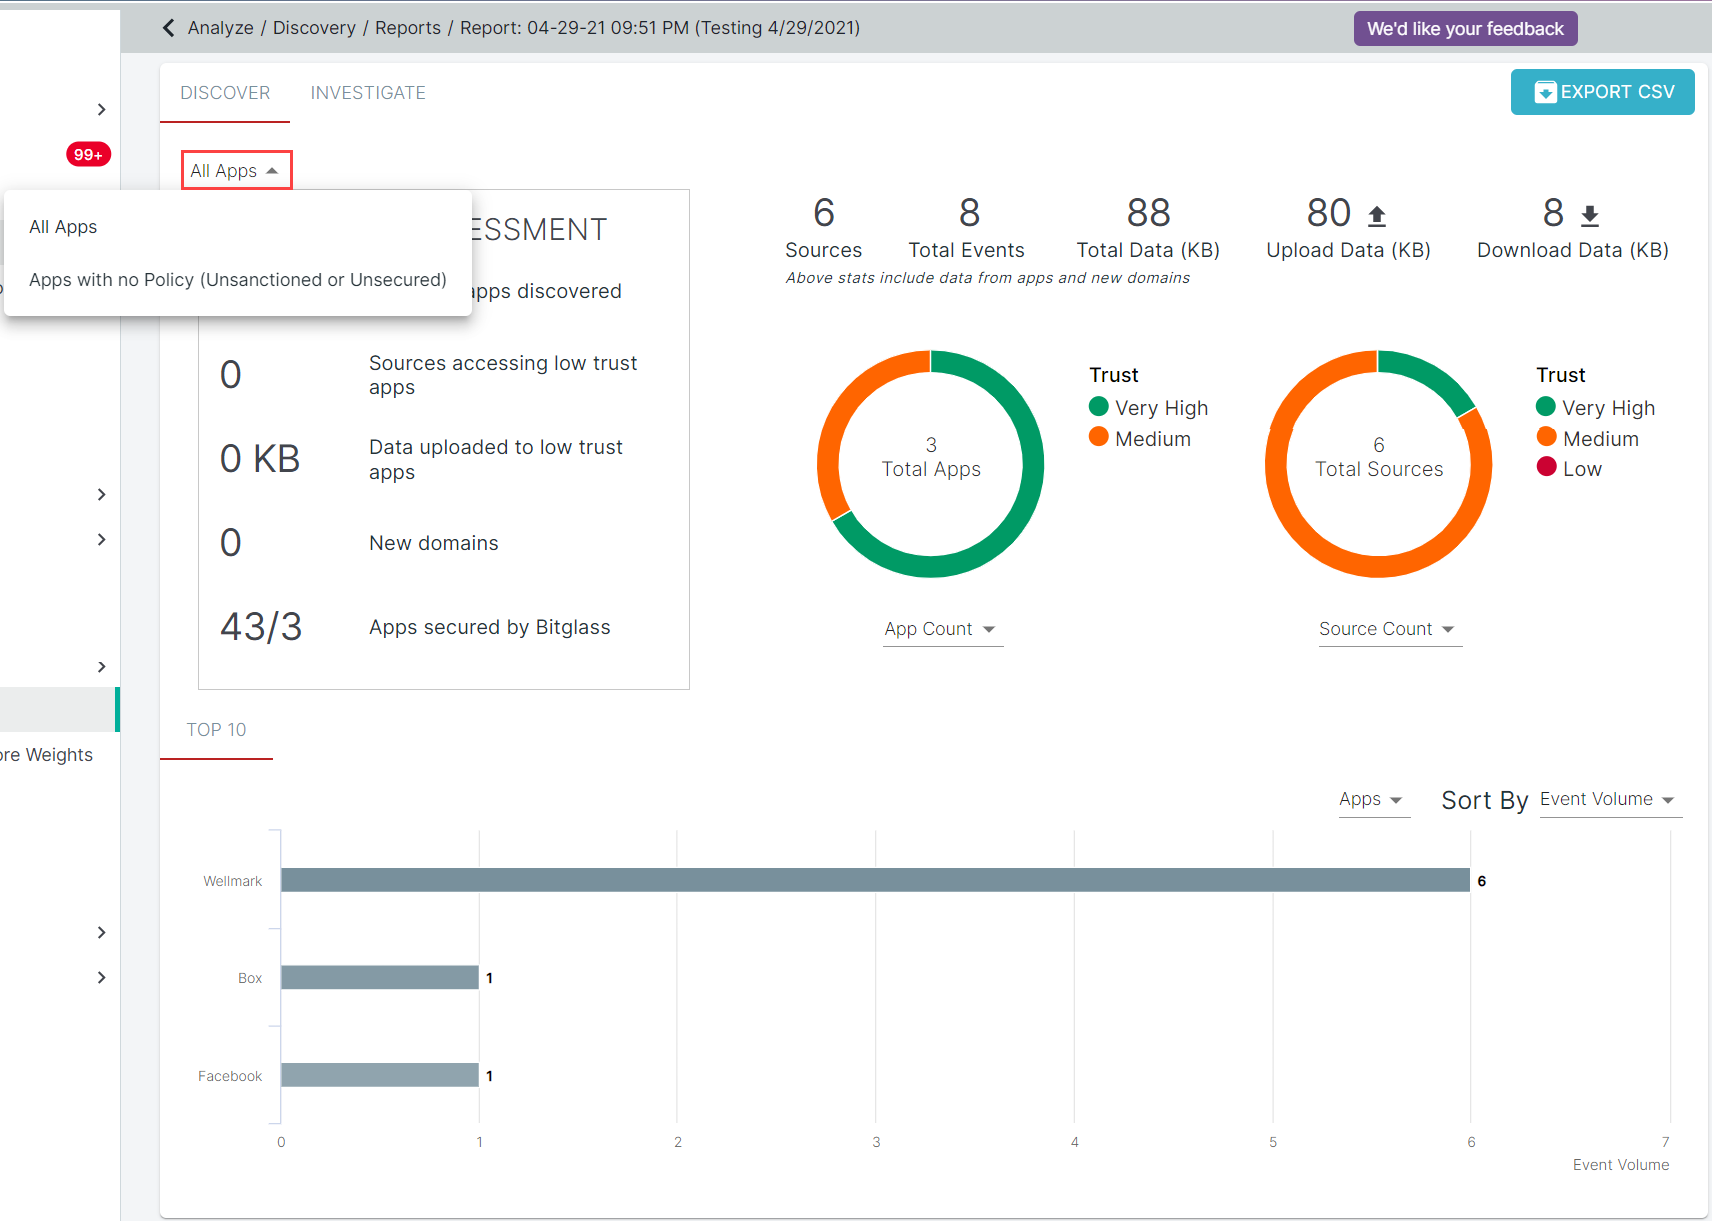
- All Apps: Select this option to visualize all the applications irrespective of they being unsanctioned, sanctioned, protected and unsecured.
- Apps with no Policy (Unsanctioned or Unsecured): Select this option to visualize only unsanctioned and unsecured applications.
Cloud Risk Assessment
The Cloud Risk Assessment displays the number of low trust apps and number of users accessing those applications.
Admins can utilize this information to gain insight to how many applications they should investigate and look to limit or control, as well as how many users are potentially putting the company at risk (is it a small group of users or is it a large percentage of the company).
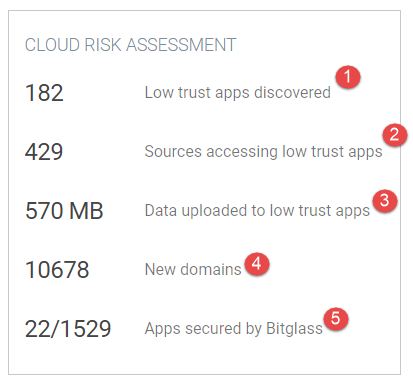
- Displays the number of apps that were discovered that Forcepoint Data Security Cloud | SSE identified as low trust.
- Lists the number of unique users/sources in the company who have been accessing the low trust applications.
- The amount of data that was uploaded to the low trust applications. Indicates potential data leakage as users or sources uploaded data to an untrustworthy application outside of the company licensed applications.
- How many new domains were identified within your logs.
- How many apps identified in your logs are secured by Forcepoint Data Security Cloud | SSE out of the total number of apps identified.
Summary Graphs
The summary pie graphs and accompanying information provides a high level overview of the total amount of events, sources and data transactions across all applications or unsanctioned and unsecured applications broken down by trust level.
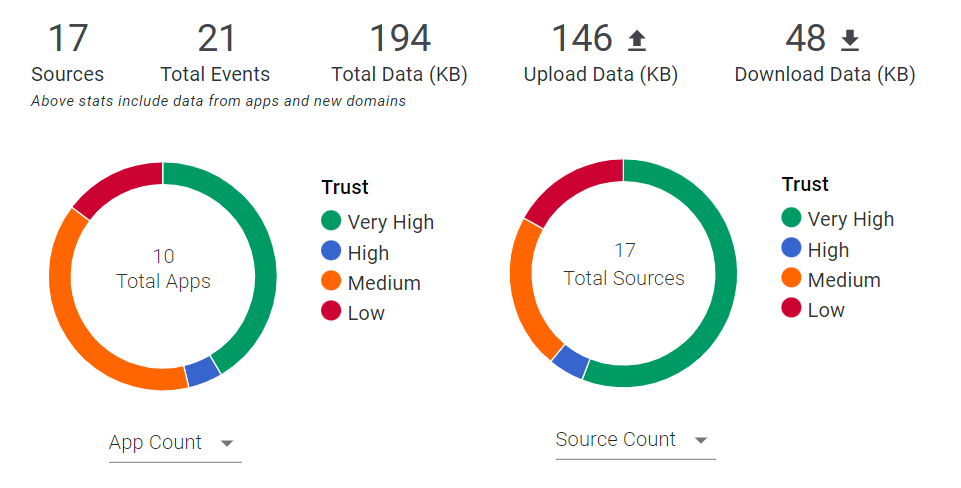
- The information at the top shows the total number of events (in the thousands) across all applications and new domains, the total number of sources, total data transactions and data uploaded/downloaded.
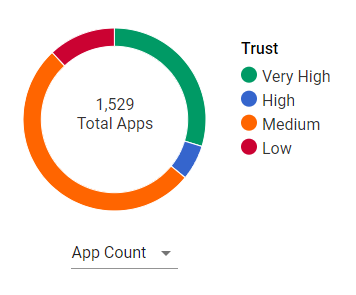
- The graphs show various information broken down by the trust level of the application (Very High, High, Medium, Low which equates to our 1-4 star rating).
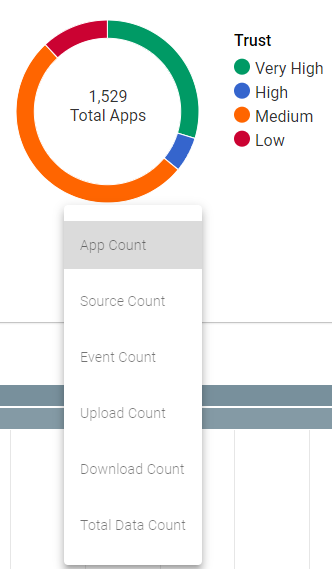
- App Count: The total number of apps broken down by their trust ranking
- Source Count: A break down of the number of sources accessing applications of each of the trust rating (that is, how many sources accessed an application with a low/medium/high/very high trust rating).
- Event Count: Total number of events within applications of each of the trust ratings.
- Upload Count: Total amount of data uploaded separated by the trust rating of applications.
- Download Count: Total amount of data downloaded separated by the trust rating of applications.
- Total Data Count: Total data uploaded/downloaded separated by the trust rating of applications.
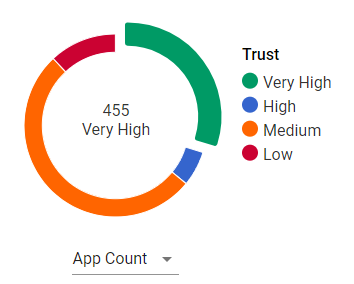
- By default the number in the middle of the circle graph displays the total number count for the option you have chosen mentioned above. Highlighting one of the color sections
will display the number count within that trust rating. Clicking on the section will isolate it so you can keep the number within that trust rating always displayed.
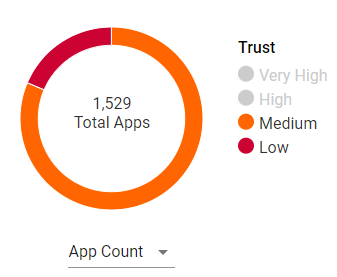
- Selecting one of the Trust ratings on the right side will eliminate that rating from the view. For example, if you wanted to zoom in on Low or medium trust rated applications
click the other two trust options to turn them off.
Volume Chart
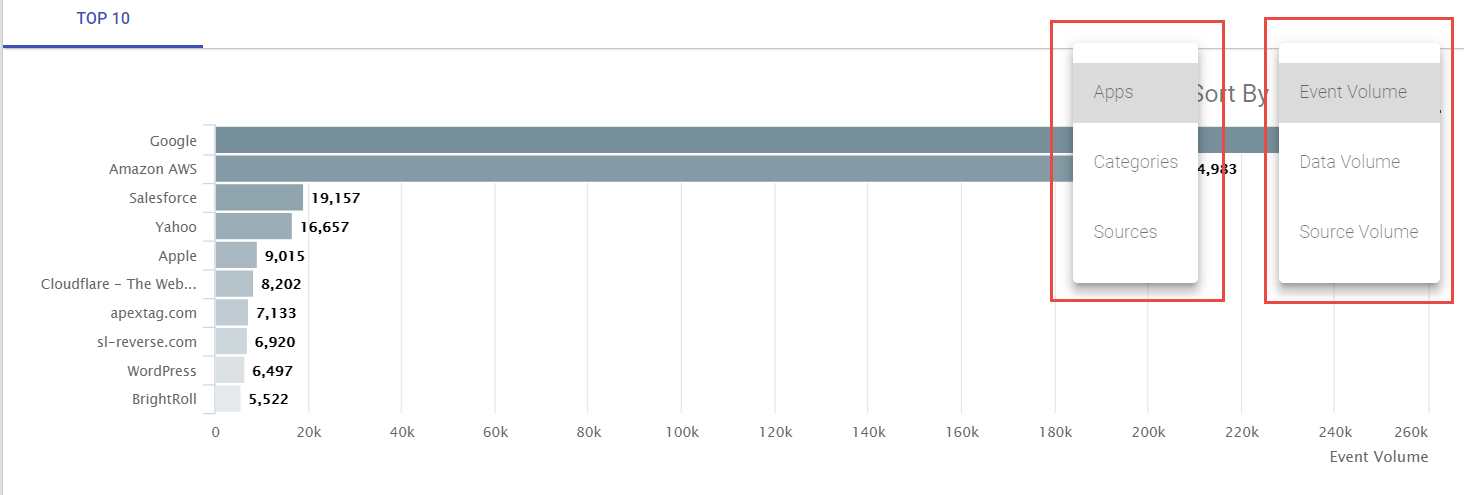
At the bottom of the page is a bar chart showing the event, data, or source volume across apps, categories, or sources.
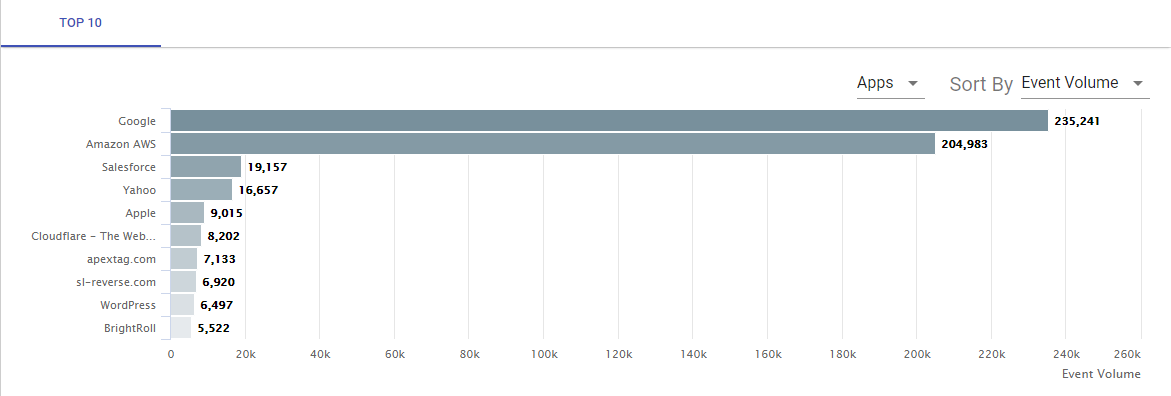
- The bar chart displays the top 10 by volume to help identify the most used apps or the problem users at a quick glance. The chart can be sorted in a number of ways:
- Apps: Which apps had the most volume of usage.
- Categories: Shows which app categories were the most used, easy way to see if users are utilizing filestorage systems or if it's primarily things like media/entertainment and social media.
- Sources Which users or sources were utilizing the ShadowIT applications the most.
- The Volume displayed can be sorted by Event or Data volume.
- Event: Sorts the top 10 list by total number of events (connections).
- Data Volume: Sorts the top 10 list by the total volume of data being uploaded and downloaded by the user within the applications.