Viewing User and Device Activity
The User/Device Activity page displays the users activity over the past 7 days and can also show their activity baselined against groups they belong to.
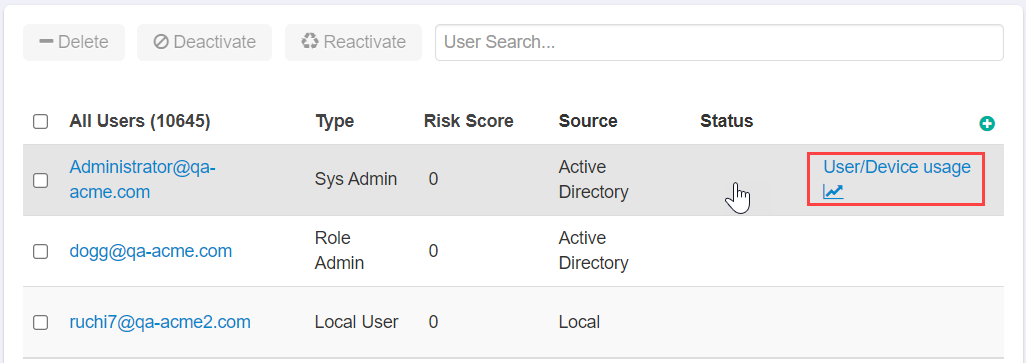
Highlight over the user's name in the user card and click on the User/Device Usage option that appears on the right side.
- The Activity card allows you to view information on the users activity over the past 7 days.
- You can view by downloads, uploads, or file views on the cloud applications themselves or you can view that information on Watermark, DLP, and DRM Activity.
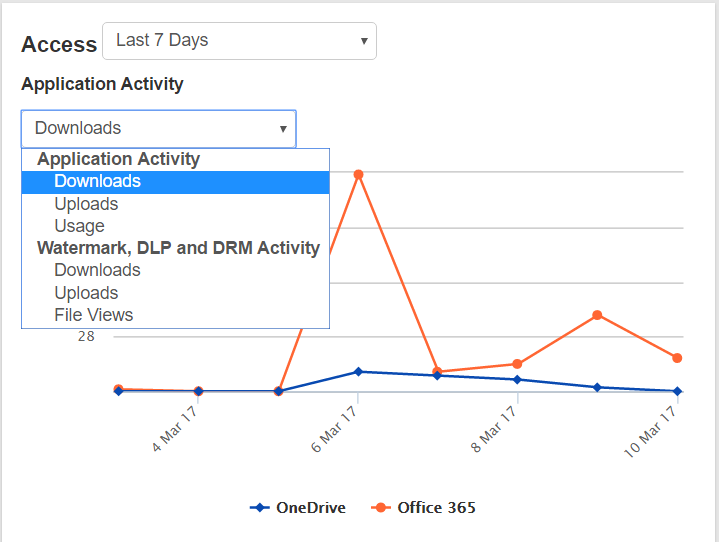
- You can view by downloads, uploads, or file views on the cloud applications themselves or you can view that information on Watermark, DLP, and DRM Activity.
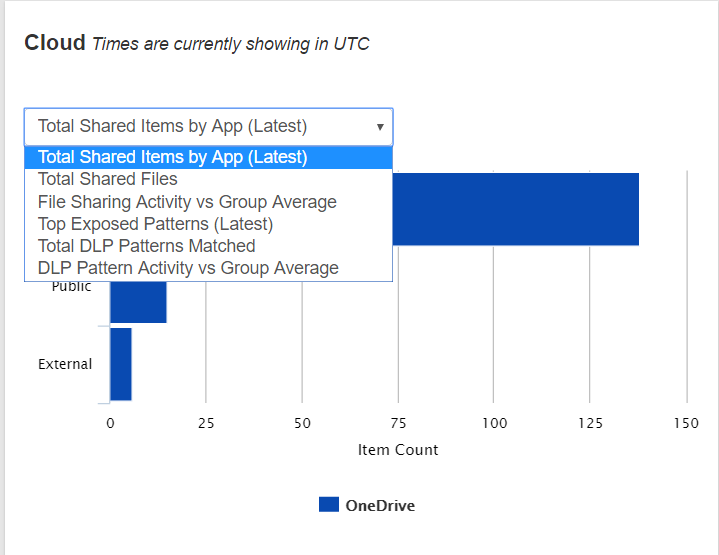
- The Cloud card contains two graphs that can be customized to display: Total Shared Items by App (Latest), Total Shared Files, File Sharing Activity vs Group Average, Top
Exposed Patterns (Latest), Total DLP Patterns Matched, or DLP Pattern Activity vs Group Average.
- The comparison graphs will display the users recent activity (over the past 7 days) compared to the average activity of a group (averaged over 90 days) that they belong to. For example, the
below image shows the user activity compared to the average activity of the group Engineering. You can see the graph bars indicating the users activity color coded for type of activity
(External, Private, Public, Internal) with the dots representing the average of the group.
- For DLP activity there is only one bar, but again indicates the users usage (the colored bar) versus the group (dot).
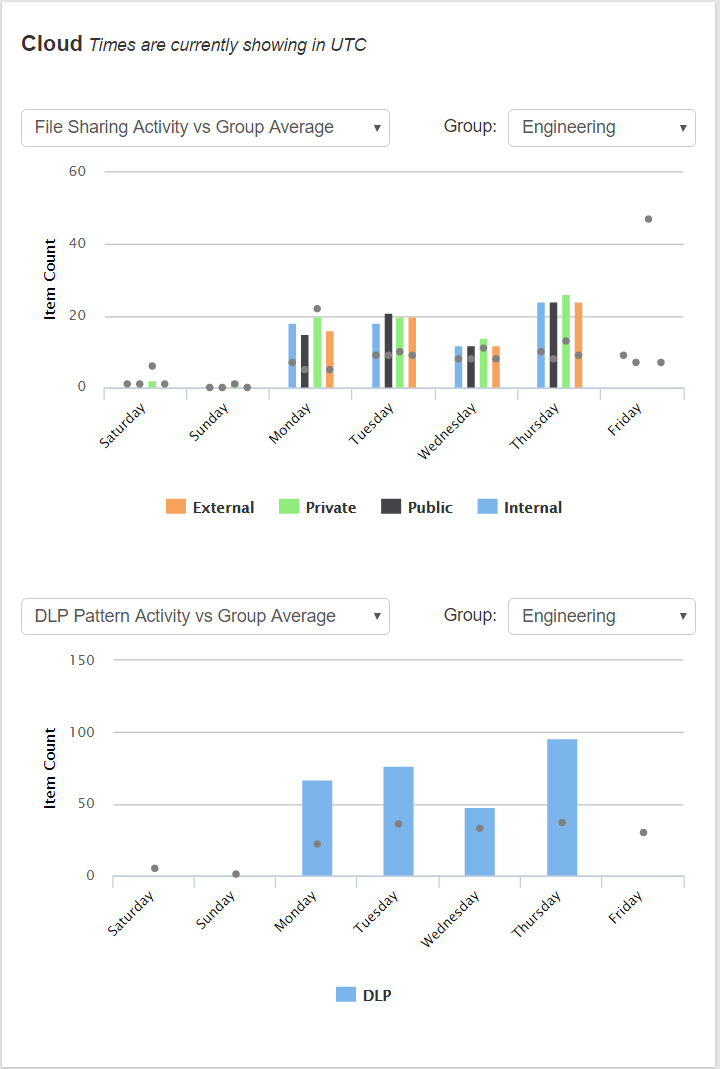
- For DLP activity there is only one bar, but again indicates the users usage (the colored bar) versus the group (dot).
- The comparison graphs will display the users recent activity (over the past 7 days) compared to the average activity of a group (averaged over 90 days) that they belong to. For example, the
below image shows the user activity compared to the average activity of the group Engineering. You can see the graph bars indicating the users activity color coded for type of activity
(External, Private, Public, Internal) with the dots representing the average of the group.
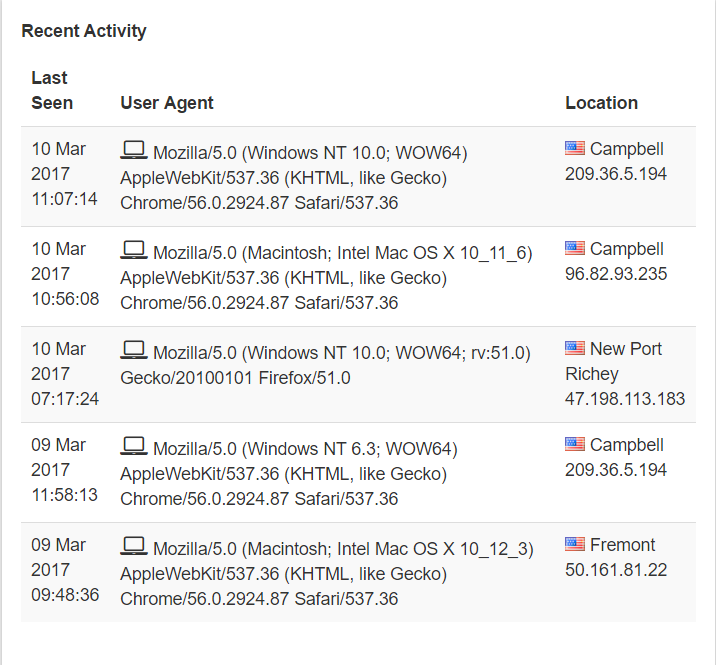
- The Recent Activity card displays the most recent connections made by the users registered devices and provides details about the machine they connected from and their location.
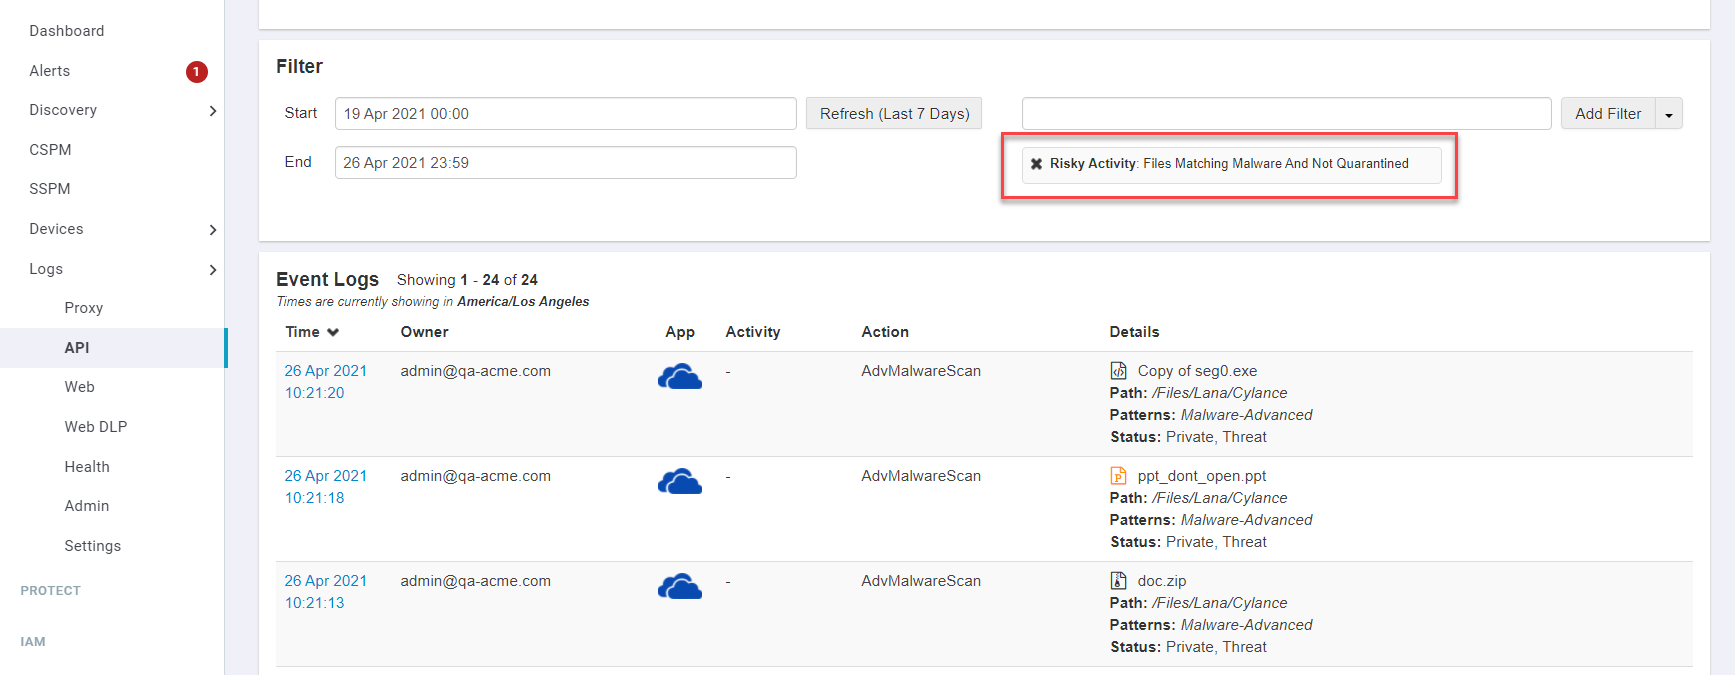
- The Risk Scorecard shows a breakdown of the number of risky events identified of each of the two main activities we track. You can also click on the number of events to
be taken to the API Event Logs page where you can view a list of all of the events that were identified.

- The Mobile Devices card displays the number of mobile devices they have configured a Forcepoint Data Security Cloud | SSE protected app on and allows you to
perform a Selective or Full Device Wipe.

- The Managed Devices card displays the registered managed devices they have registered with Forcepoint Data Security Cloud | SSE and the OS it contains. You can
select the device name under the Managed Devices column to view more information about it such as it's GUID and domain it belongs to.
