Troubleshooting Forcepoint Insights SIEM App in QRadar
After integrating QRadar application with Forcepoint Insights SIEM, you can troubleshoot issues if required.
How to check if the Forcepoint Insights SIEM App is configured properly and logs are getting populated in QRadar?
- Navigate to Log Activity and do an advanced search for:
SELECT "startTime", QIDNAME (qid), UTF8(payload) FROM events WHERE (QIDNAME (qid) LIKE 'Forcepoint % Log') order by "startTime" DESC LIMIT 1000 LAST 7 DAYSThe event details should appear for selected time period.
What to do if Log Activity is not showing any data?
There can be three scenarios for this issue:
Scenario 1
The Forcepoint Insights SIEM App is running fine and there is no new log event data available in Forcepoint Insights for selected collections. In this case, you just have to wait for some time till new log event data is generated for selected collections.
Scenario 2
- Navigate to Admin tab and expand the Apps drop-down from the left column.
- Select Forcepoint Data Security Cloud App Log Configuration and then click on the Configuration option on the right screen.
- On the Configuration page, fill in the form details if not filled and click Save.
Give it about 30 minutes for logs to be pulled after receiving a success message. Make sure the inputs provided for Insights Host and Platform URL are accessible from your network.
How to check application logs to capture the problem?
Application logs can be used to debug any issue with the Forcepoint Insights SIEM App.
- SSH into the QRadar console instance.
- Check the App-ID for the Forcepoint Insights SIEM App using
following command which will list app ID for all of the installed apps.
sudo /opt/qradar/support/recon ps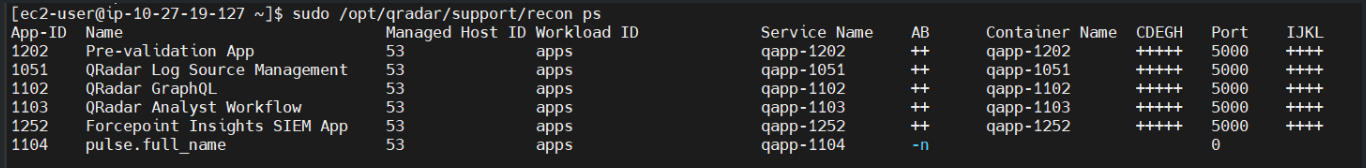
- On the QRadar instance the logs are stored in file /store/docker/volumes/qapp-<App-ID>/log. Use the App-ID that we get in step 2
- Additionally log level can be changed for more detailed logs. Refer to Change Log Level topic below for steps to change log level. Make sure to revert the log level back to “INFO” level once debugging is completed.
Change Log Level
- Create SEC token in QRadar refer Creating an authorized service token for QRadar Operations for more details. During SEC creation make sure to provide User Role as Admin.
- After token creation run following curl command to send API request to change log
level.
curl --location 'https://<Console-IP>/console/plugins/<App-ID>/app_proxy/log_level' \
--header 'SEC: <YOUR-SEC-TOKEN>' \
--form 'level="DEBUG"'