Understanding SCIM usage analytics
You can view analytics for SCIM usage from the SCIM page. You can also drill-down the logs to each API call.
Steps
-
From the left Navigation Pane, click the SCIM
 icon.
icon.
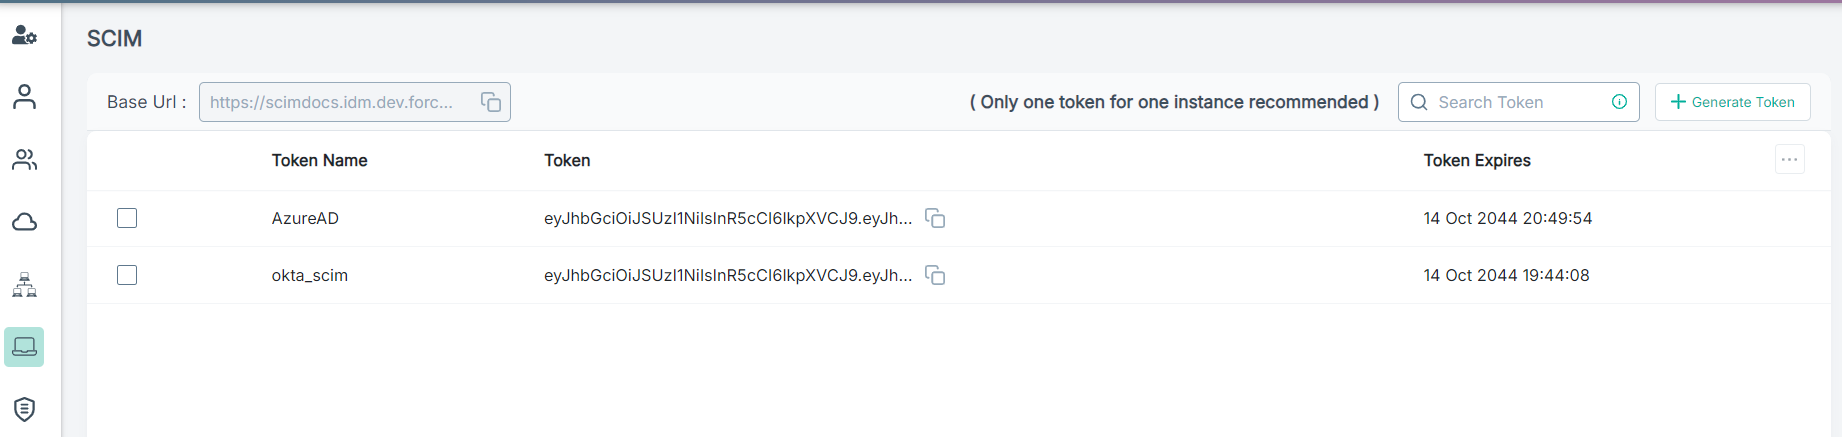
The following page opens displaying existing SCIM access tokens.
-
Select the specific SCIM Token from the list for which you want to view the analytics.
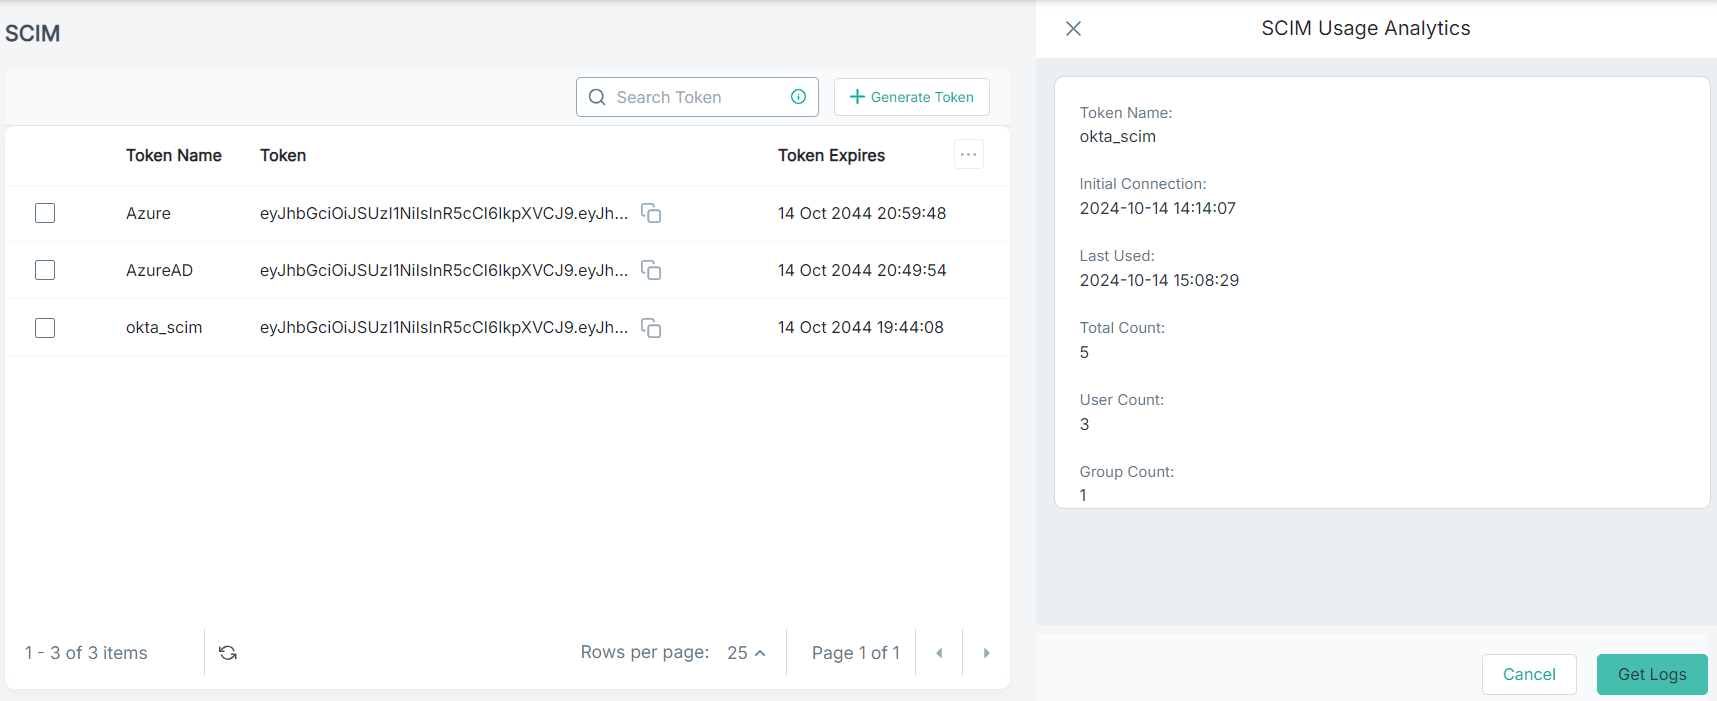
The SCIM Usage Analytics pane opens displaying the following details:- Token Name - Displays the name of the token.
- Initial Connection - Displays the timestamp when an initial connection was made.
- Last Used - Displays the timestamp when the last sync happened.
- Total Count - Displays the total number of API calls made between Forcepoint Data Security Cloud and IdP.
- User Count - Displays numbers of users synced from the IdP application to Forcepoint Data Security Cloud.
- Group Count - Displays numbers of groups synced from the IdP application to Forcepoint Data Security Cloud.
-
To view the logs in detail, click Get Logs.
The SCIM Logs page opens displaying all the API calls for the selected SCIM Token.
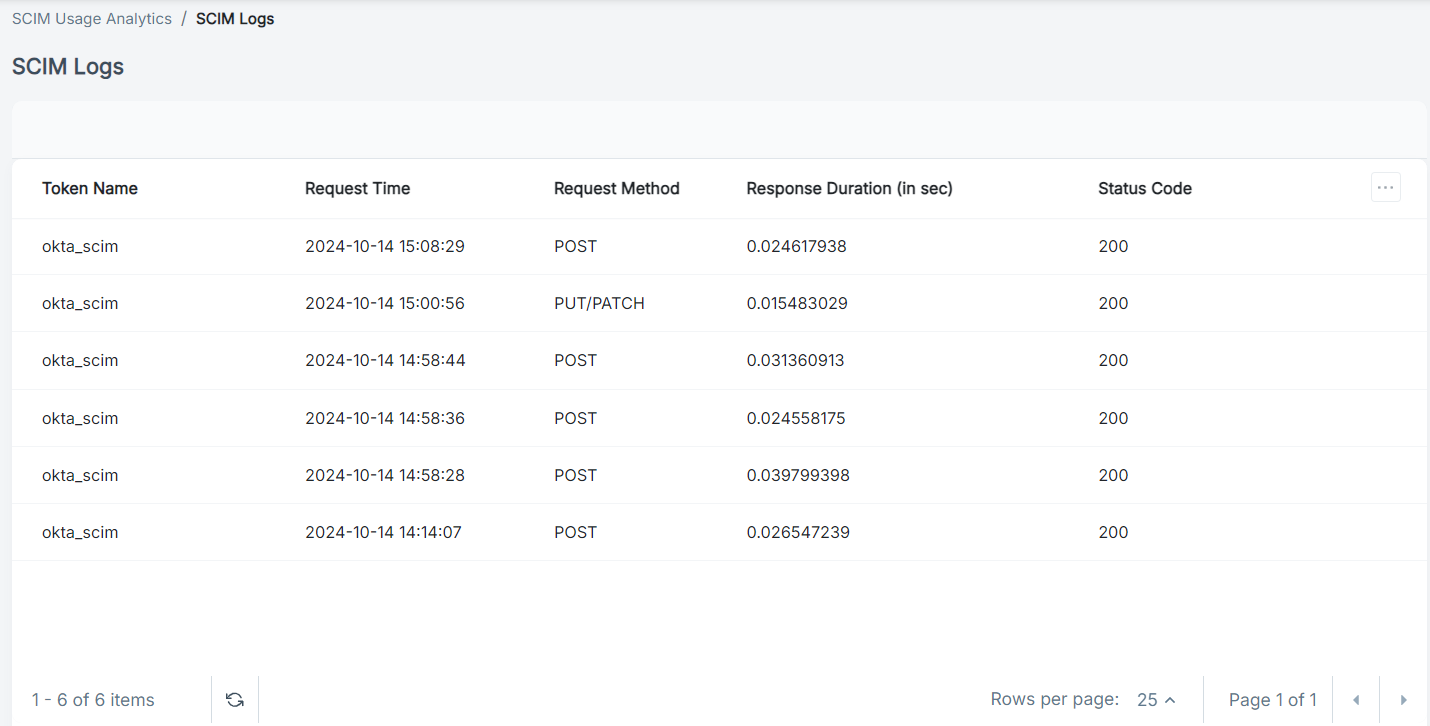
- Token Name: Displays name of the token.
- Request Time: Displays the date and time of the request.
- Request Method: Displays the type of API request.
- Response Duration (in sec): Displays the duration of the response in seconds.
- Status Code: Displays the HTTP status code associated with the response.
-
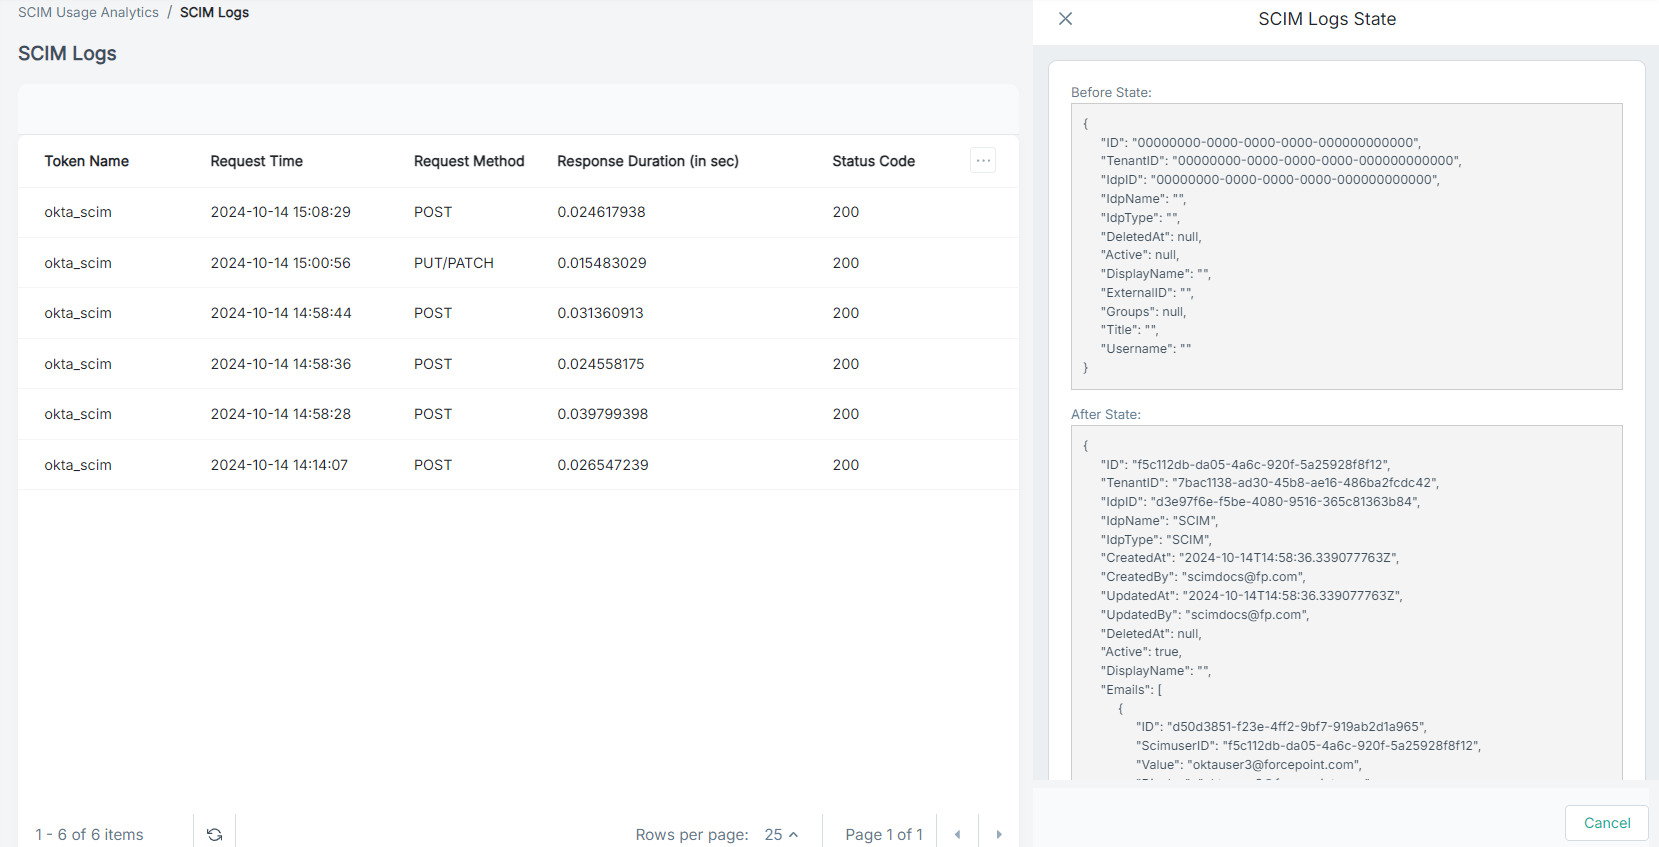
To view details of the API call, click the log.
The SCIM Logs State pane opens displaying the Before State and After State sections.