Threat Protection
Use the Threat Protection dashboard for an overview of your cloud usage across your licensed channels—API, CASB Inline and Web.
While viewing any other dashboard or page, click the ![]() icon to access the Threat Protection
dashboard.
icon to access the Threat Protection
dashboard.
- 1
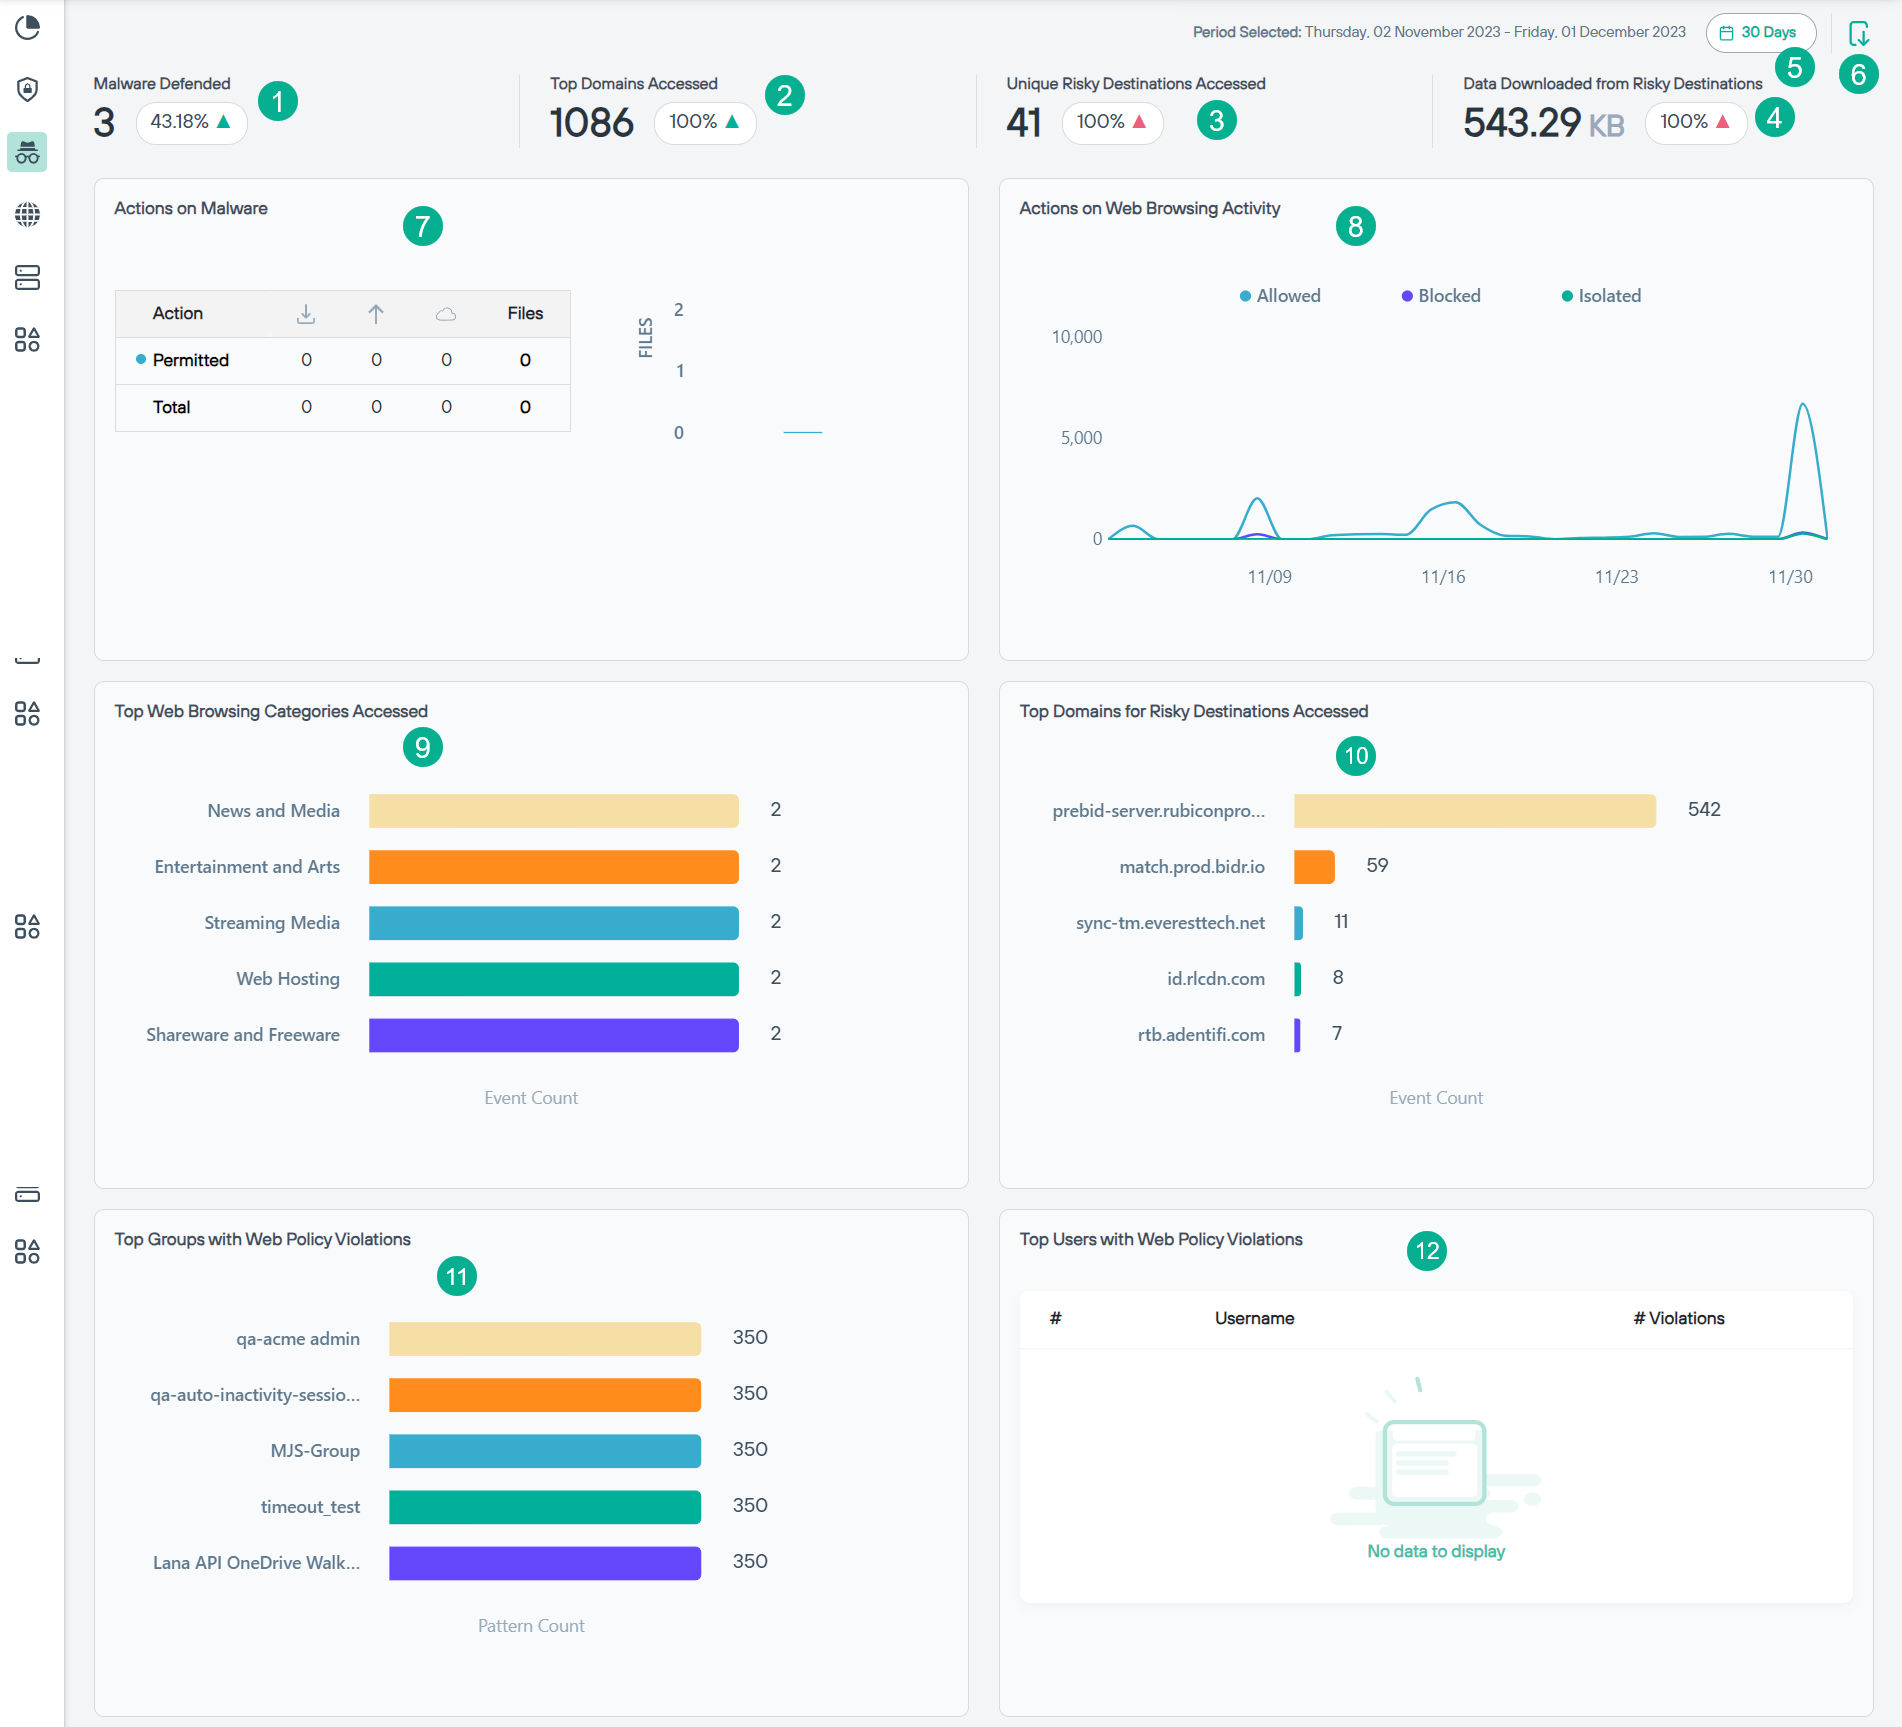
- Malware Defended: Indicates the number of files on which malware was defended for the selected period and percentage of malware defended when compared to previous period
along with the
 or
or  icon indicating if the malware defended have increased or decreased for
current period when compared to previous period.
icon indicating if the malware defended have increased or decreased for
current period when compared to previous period. - 2
- Top Domains Accessed: Indicates the number of top domains accessed by users for the selected period and percentage of top domains accessed when compared to previous
period along with the or icon indicating if the top domains accessed have increased or
decreased for current period when compared to previous period.
- 3
- Unique Risky Destinations Accessed: Indicates the number of unique risky destinations accessed by users for the selected period and percentage of unique risky
destinations accessed when compared to previous period along with the or icon
indicating if the unique risky destinations accessed have increased or decreased for current period when compared to previous period.
- 4
- Data Downloaded from Risky Destinations: Indicates volume of data downloaded from risky destinations for the selected period and percentage of data downloaded from risky
destinations when compared to previous period along with the or icon indicating if the data
downloaded from risky destinations have increased or decreased for current period when compared to previous period.
- 5
- Time filter: Click the time filter to view the past 7 days, 14 days, 30 days, 45 days or 60 days data for all widgets on the dashboard. By default, dashboard loads with a 30 days' time filter.
- 6
- Export to PDF: Click the
 icon to export the dashboard in PDF.
 - 7
- Actions on Malware: Indicates the actions taken when malware is detected in tabular and pictorial chart formats.
- 8
- Actions on Web Browsing Activity: Indicates the summary of actions taken while browsing websites. You can place the mouse pointer along the line to know the details at that point.
- 9
- Top Web Browsing Categories Accessed: Indicates the top 5 web browsing categories accessed based on the distinct user count.
- 10
- Top Domains for Risky Destinations Accessed: Indicates the top 5 risky destinations accessed based on the distinct user count.
- 11
- Top Groups with Web Policy Violations: Indicates the top 5 user groups with the most web policy violations across the time period selected.
- 12
- Top Users with Web Policy Violations: Lists the top 5 users with the most web policy violations along with the number of policy violations across the time period selected.