Summary
The Summary dashboard is the landing dashboard when you access Insights from SSE.
While viewing any other dashboard or page, click the ![]() icon to access the Summary dashboard.
icon to access the Summary dashboard.
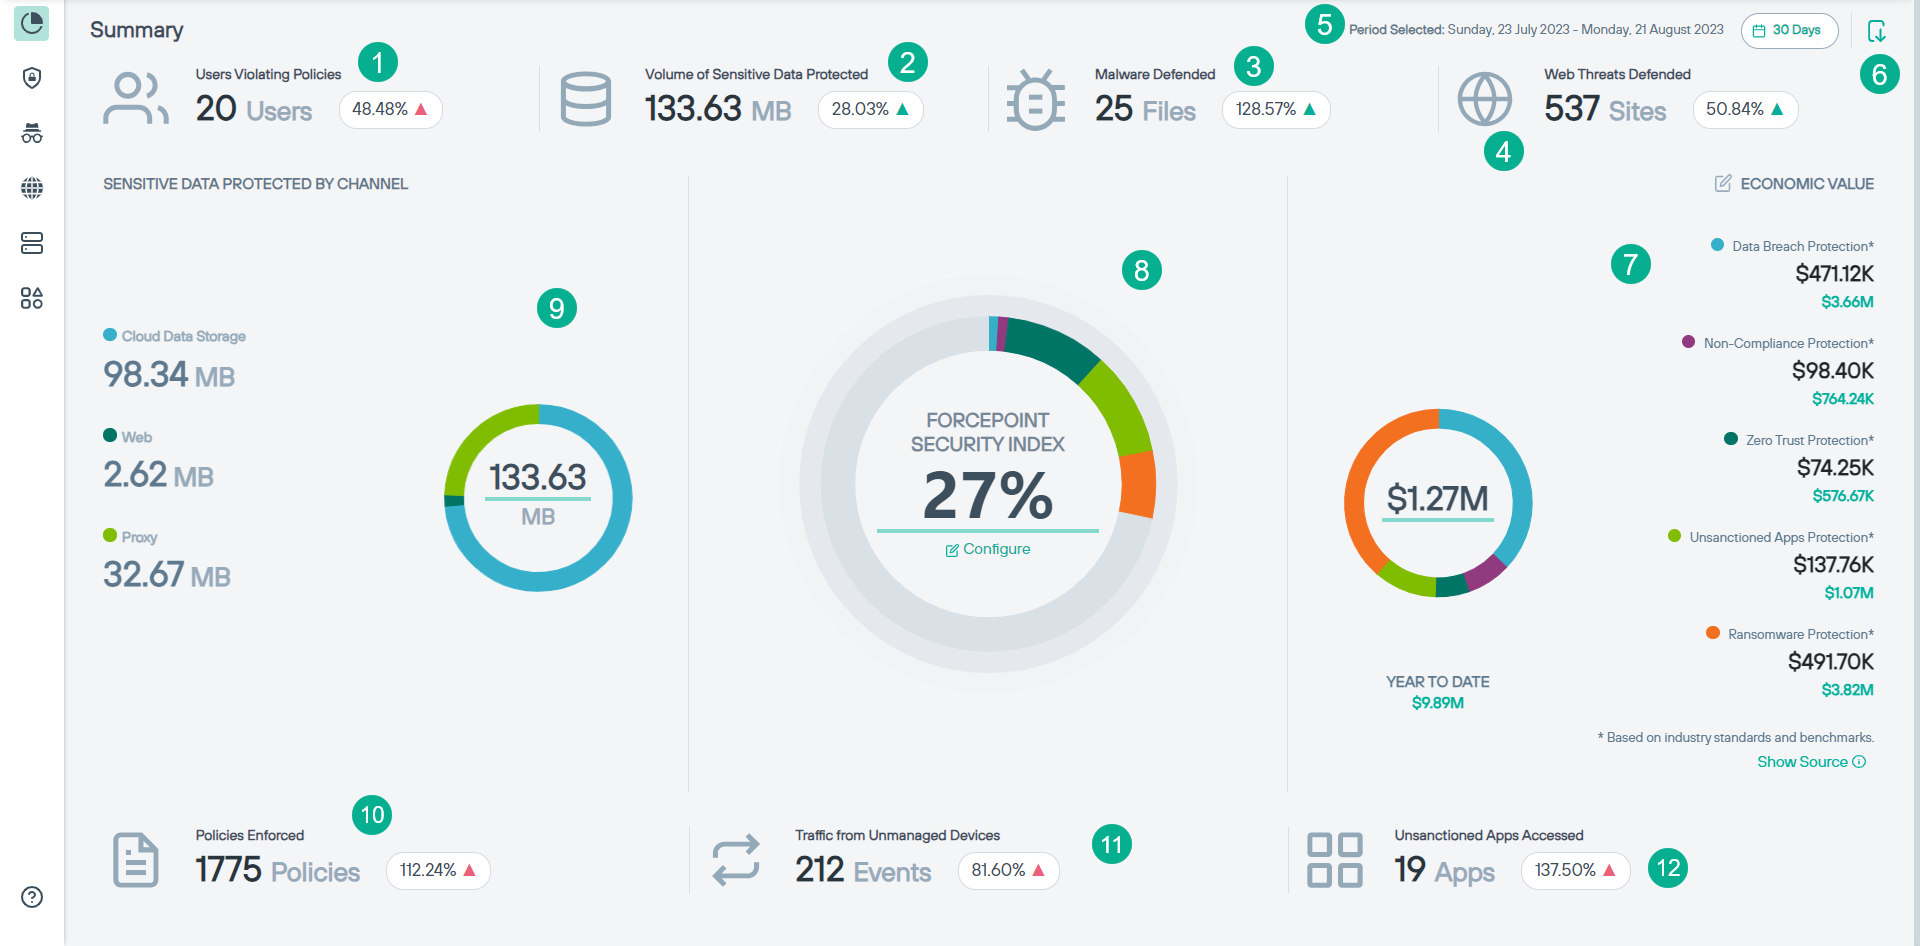
- 1
- Users Violating Policies: Indicates the number of unique users who violated the policies for the selected period and percentage of users who violated policies when
compared to previous period along with the
 or
or  icon indicating if the policies
violations have increased or decreased for current period when compared to previous period.
icon indicating if the policies
violations have increased or decreased for current period when compared to previous period. - 2
- Volume of Sensitive Data Protected: Indicates the volume of sensitive data scanned and protected for the selected period and percentage of volume of sensitive data
protected when compared to previous period along with the or icon indicating if the
volume of sensitive data protected have increased or decreased for current period when compared to previous period.
- 3
- Malware Defended: Indicates the number of files on which malware was defended for the selected period and percentage of malware defended when compared to previous period
along with the or icon indicating if the malware defended have increased or decreased
for current period when compared to previous period.
- 4
- Web Threats Defended: Indicates the number of sites on which threat was defended for the selected period and percentage of web threats defended when compared to previous
period along with the or icon indicating if the web threats defended have increased or
decreased for current period when compared to previous period.
- 5
- Time filter: Click the time filter to view the past 7 days, 14 days, 30 days, 45 days or 60 days data for all widgets on the dashboard. By default, dashboard loads with a 30 days' time filter.
- 6
- Export to PDF: Click the
 icon to export the dashboard in PDF. Refer to Exporting dashboard as PDF
file for further information.
icon to export the dashboard in PDF. Refer to Exporting dashboard as PDF
file for further information. - 7
- Economic Value: Indicates a projected economic value saved by the use of Forcepoint ONE to protect and secure your data and cloud usage for the selected period
along with the projected economic value for each category. Also, displays the projected economic value for year to date.To tailor the economic value calculation for your specific purposes, refer to Adjusting Economic Value.Note:
- These estimates are based out of the Cost of a Data Breach report 2022 by Ponemon Institute and IBM.
- The projected calculation is based only on the timeframe selected and any adjustments to the average daily costs entered. Customer traffic is not used as part of the calculation.
- 8
- Forcepoint Security Index: Indicates the effectiveness of your Forcepoint ONE deployment when compared to recommended best practices and your licensed
user coverage in percentage.
You can either click on the donut chart or Configure to adjust FSI score based on your Forcepoint ONE deployments. To know about various components involved in adjusting FSI, refer to Adjusting Forcepoint Security Index.
- 9
- Sensitive Data Protected by Channel: Indicates volume of sensitive data protected for each channel (API – Cloud Data Storage, Web and CASB Inline (Proxy)) in GB for the selected period.
- 10
- Policies Enforced: Indicates the number of policies that were enforced for the selected period and percentage of number of policies that were enforced when compared
to previous period along with the or icon indicating if the policies enforced have
increased or decreased for current period when compared to previous period.
- 11
- Traffic from Unmanaged Devices: Indicates the number of times data was accessed from unmanaged devices for the selected period and percentage of number of times data was
accessed from unmanaged devices when compared to previous period along with the or
icon indicating if the data accessed from unmanaged devices has increased or decreased for current period when compared to previous period.
- 12
- Unsanctioned Apps Accessed: Indicates the number of unsanctioned applications accessed for the selected period and percentage of unsanctioned applications accessed when
compared to previous period along with the or icon indicating if the access to
unsanctioned applications have increased or decreased for current period when compared to previous period.