Understanding the Browse Activity Summary widget
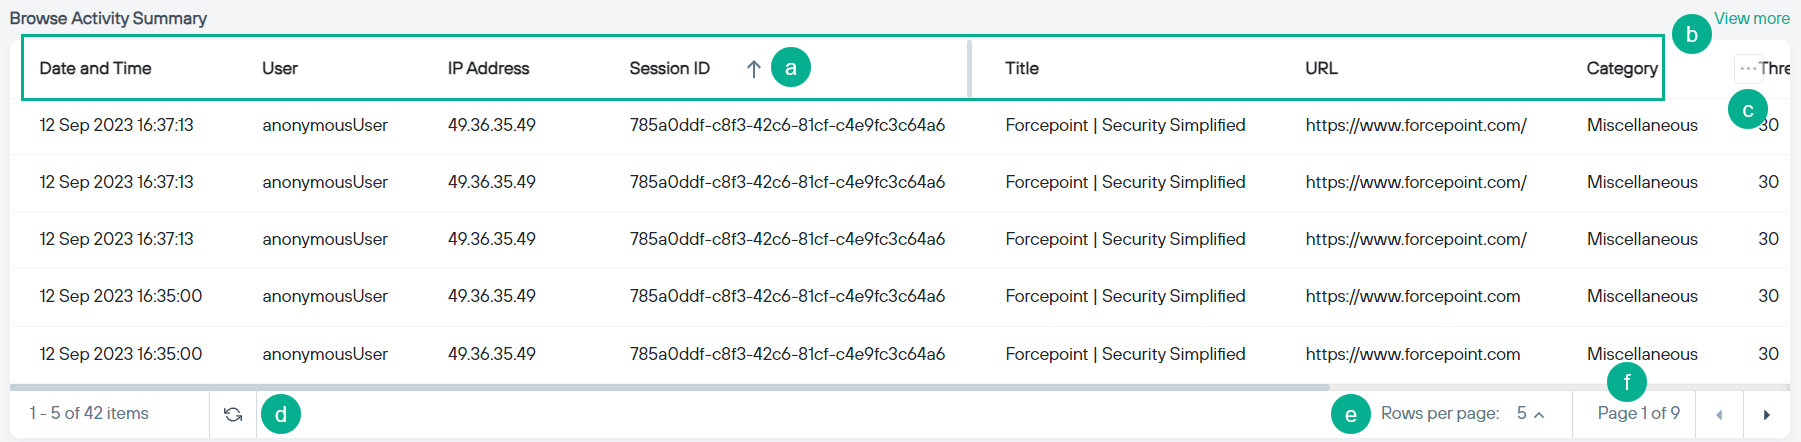
The Browse Activity Summary widget displays cumulative browsing activity and related security events per user for the selected period.
Steps
-
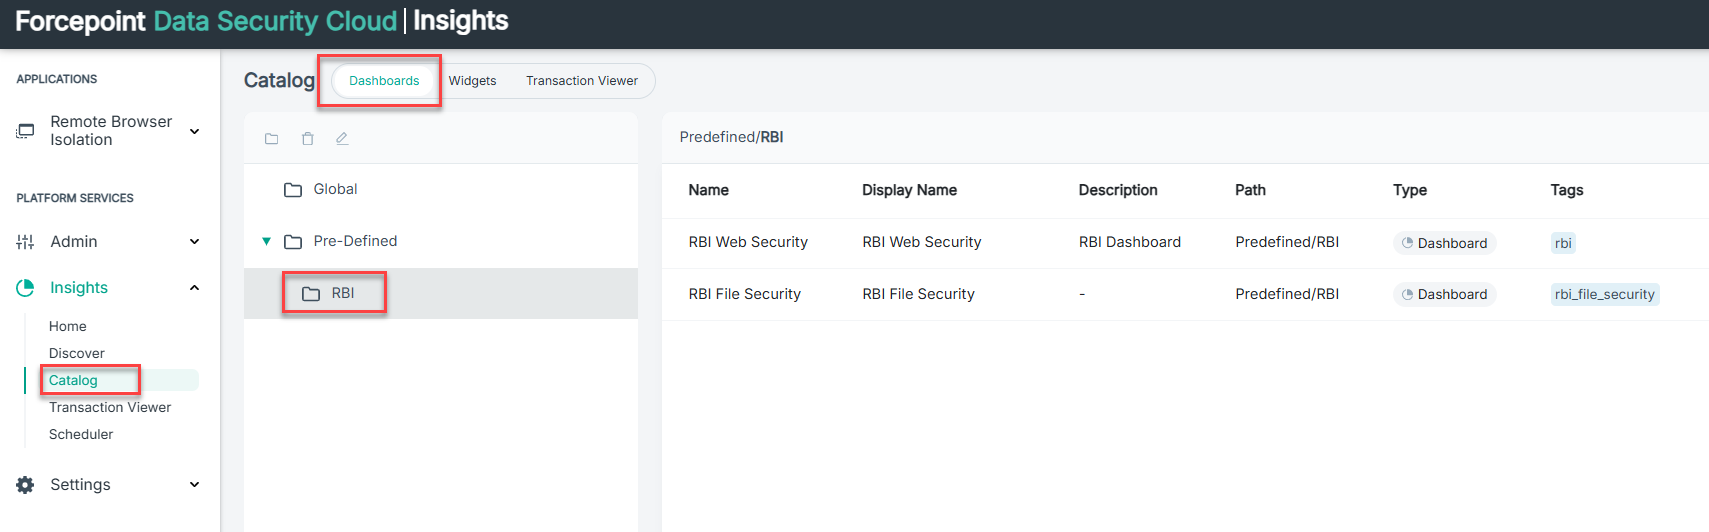
Navigate to RBI Dashboard by clicking .
-
On the Browse Activity Summary widget:
-
Click on any of the column names in the table header to sort the data in ascending or descending order.
-
Click the
 icon to open the dialog where you can hide or display optional columns.
-
Click the
 icon to refresh the data in table.
-
Click on any of the column names in the table header to sort the data in ascending or descending order.