What the Details pane shows
The Details pane is shown by default in most views. In addition to element details, the Details pane shows the most important status information for components.
The type of element determines which tabs are shown.
Figure: Info pane for a node in an Engine
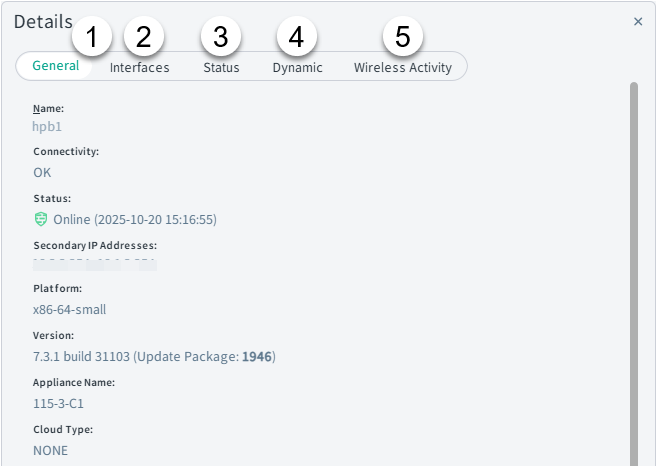
- 1
- General tab — Shows general information about the element.
- 2
- Interfaces tab — Shows information about the network ports of the selected Engine node, such as speed and duplex.
- 3
- Status tab — Shows the status of hardware and services.
- 4
- Dynamic tab - Shows interface details, including IP address, netmask, and gateway information.
- 5
- Wireless Activity tab - shows the current status, security mode, number of connected users, and channels in use.
Figure: Info pane for a Management Server
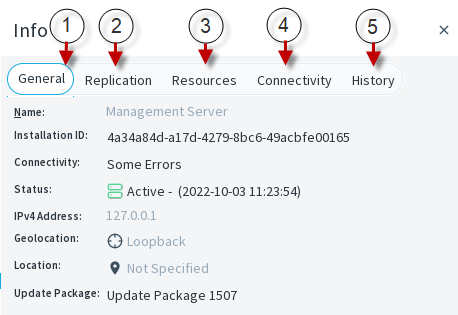
- 1
- General tab — Shows general information about the element.
- 2
- Replication tab — Shows information about the status of the database replication between the SMCaaS servers.
- 3
- Resources tab — Shows information about resource usage on the computer where the Management Server, Log Server, or Web Portal Server is installed for troubleshooting purposes.
- 4
- Connectivity tab — Shows information about the connectivity between the selected SMCaaS server and other system components.
- 5
- History tab — Shows audit information about when the element was created and modified.