How the Dashboard is arranged
On the Dashboard, you can view the status of Engines and monitored third-party devices.
By default, when you start the SMCaaS Application, you see the Dashboard. This view provides the operating and connectivity status of Security Engines and third-party components that are set up to be monitored through the SMCaaS Application.
There are several ways to open the Dashboards. For example:
- Select .
- Open a New Tab, then select Engines Dashboard under Monitoring Dashboard.
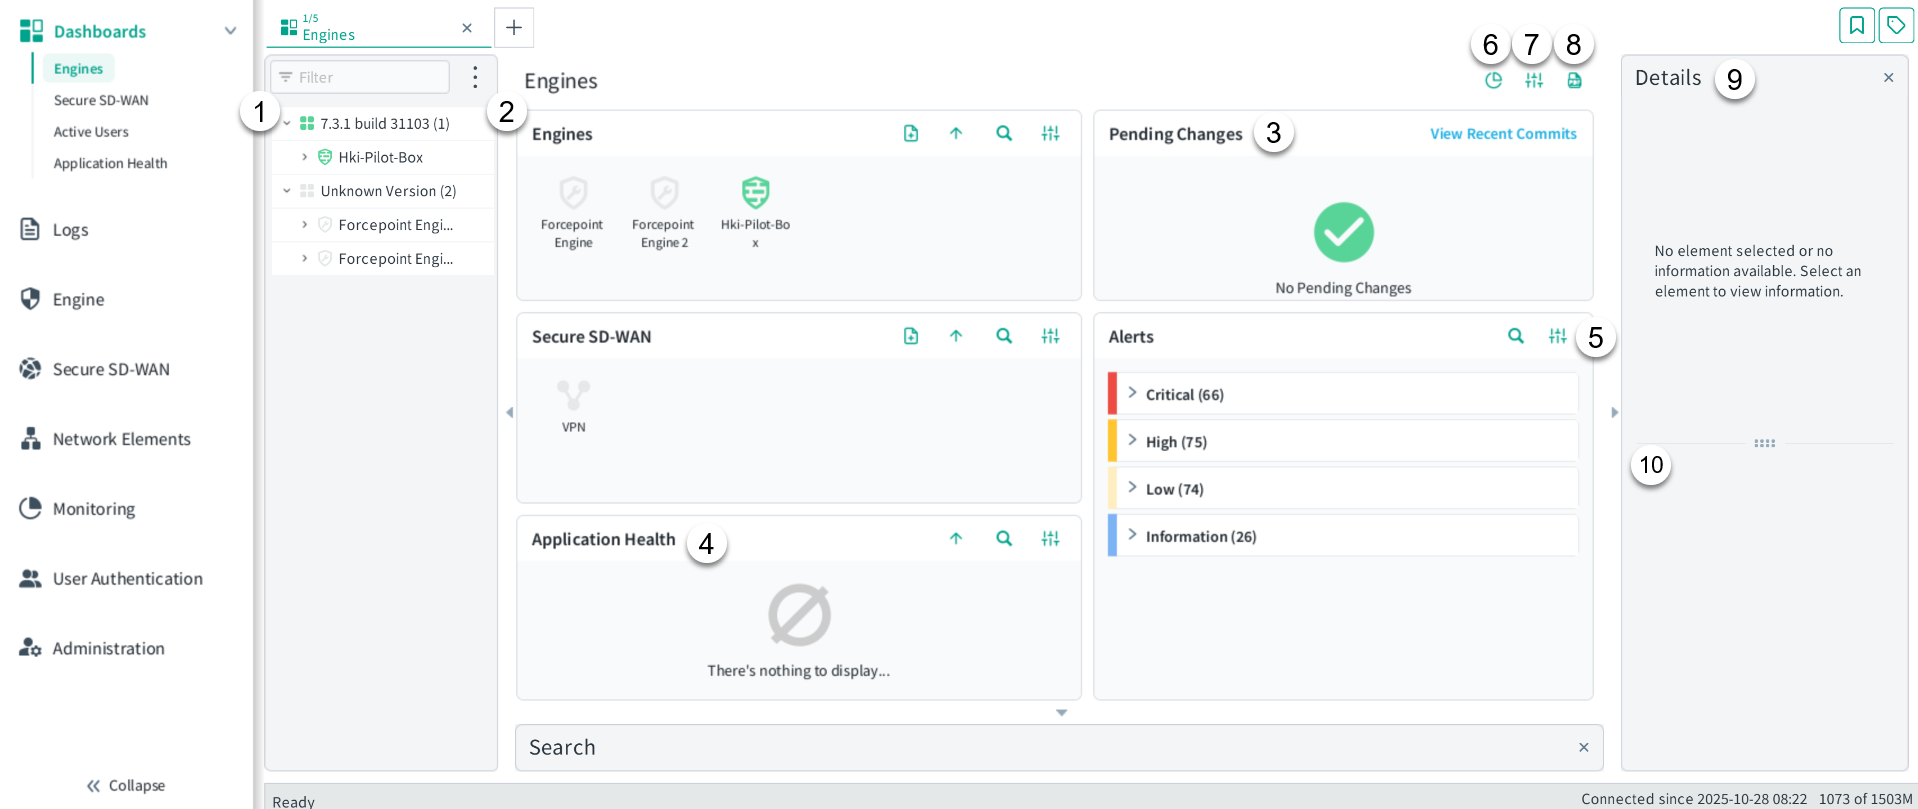
Figure: Dashboards
- 1
- The Status Tree shows the status of monitored system elements. To see the status of a component, expand the tree, then place your cursor over any element. A tooltip will display the element's IP address and status
- 2
- The Status Card (for Engine, VPNs, and other monitored elements) or the Home Page for the selected element display detailed information
about the status and configuration of monitored elements.
- Click an element's card to open its home page.
- Click
 New to add an element of the selected type.
- 3
- The Pending Changes shows configuration and policy changes that have not yet been transferred. The Recent Commits opens in the same area and shows recent policy uploads.
- 4
- The Application Health shows the network applications currently being monitored.
- 5
- The More actions allows you to organize alerts based on their severity or situation type.
- 6
- The Statistics Time-Range allows you to select the time frame for which you want to view the dashboard. The details in the widgets update according to the selected range.
- 7
- The Widgets menu allows you to add additional widgets to your current dashboard view. To reset the layout to the default dashboard view, select
 Menu > View > Layout > Reset Layout.
 - 8
- The Export to PDF menu allows you to export a snapshot of your dashboard as a PDF file. This snapshot includes all the charts, data, and information currently displayed on the dashboard.
- 9
- The Details pane shows details of the selected element. It remains blank if no element is selected in the Status Tree.
- 10
- The Drill-downs contains shortcuts to more details of the selected element. It also remains blank if no element is selected in the Status Tree.
Figure: Card size toolbar

- 1
- Auto — Selects the card size automatically based on the space available.
- 2
- Sum — Shows the number of Engines for each status. This card size is useful for large installations.
- 3
- Small cards show only the status and whether there are any active alerts for the element.
- 4
- Medium cards show the status of the element, when the last policy upload was made, and whether there are any active alerts for the element.
- 5
- Large cards show the status of the element, configuration information about the element, and whether there are any active alerts for the element. For Engines, the cards also show the current load.