What the Secure SD-WAN dashboard shows
The dashboard allows you to monitor VPN features, such as Multi-Link and VPNs.
Branches represent the VPN gateways and NetLink elements associated with each Security Engine. The dashboard summarizes status information for all branches and VPNs and you can customize the dashboard.
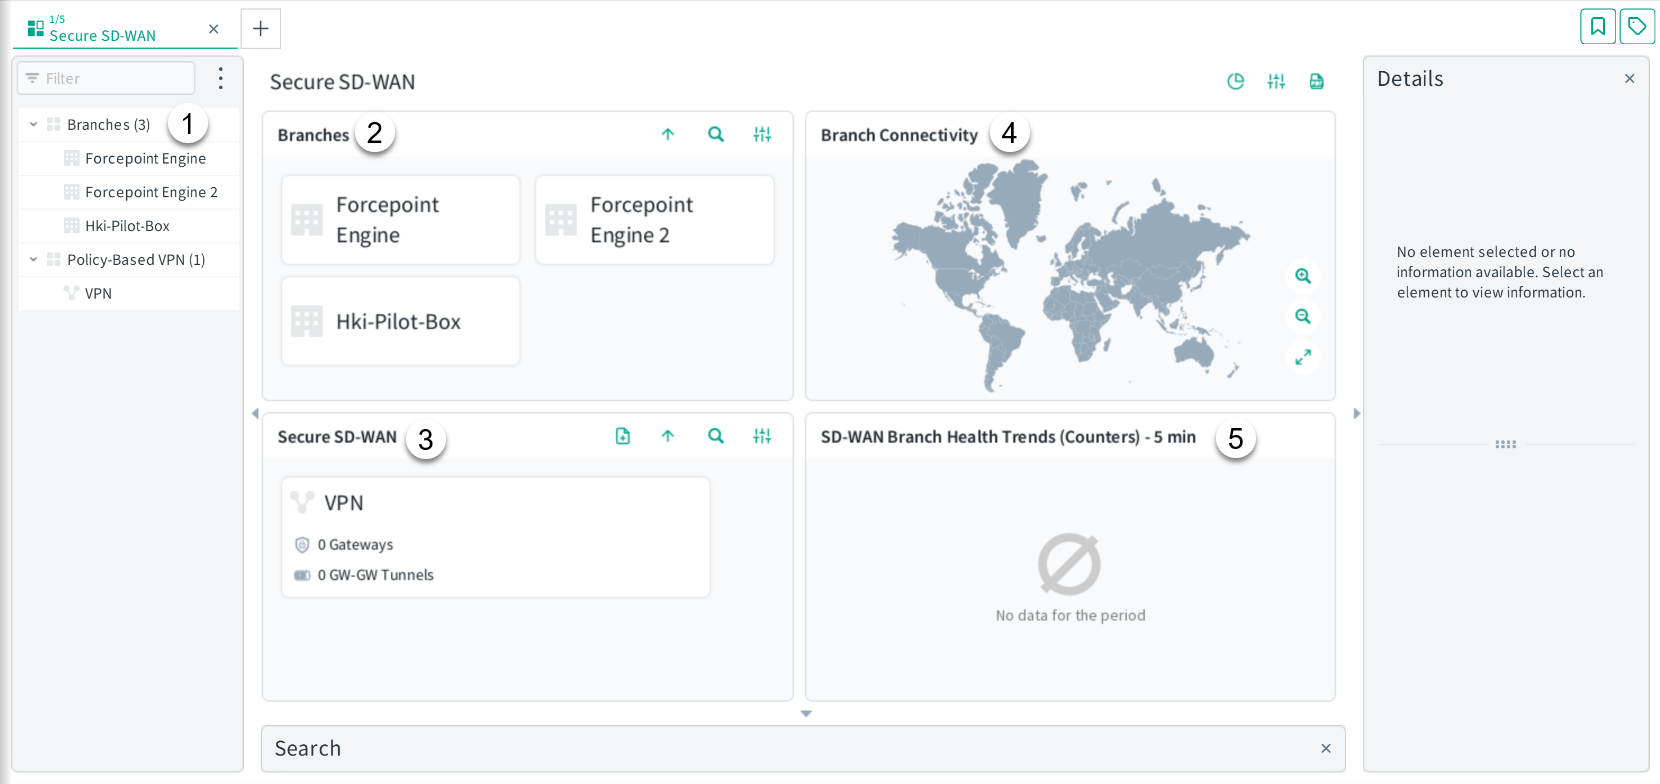
Figure: Dashboard
- 1
- The status tree shows the status of monitored branches, route-based VPN tunnels, and policy-based VPNs. A branch is shown for an Engine if the Engine has VPN gateways that are used in a policy-based VPN or route-based VPN tunnel, or if NetLinks associated with the Engine are used in an Outbound Multi-Link element.
- 2
- Contains status cards that show information about the VPN health and NetLink status of each branch. When you select an individual branch, the Dashboard view shows detailed monitoring information about the NetLinks, VPN tunnels, and traffic associated with the branch.
- 3
- Shows the overall status of VPNs and the status of gateways and tunnels in the VPNs. When you select an individual policy-based VPN or group of route-based VPN tunnels, the Dashboard view shows detailed monitoring information about the policy-based VPN or route-based VPN tunnels.
- 4
- Shows the status of all monitored branches on a map.
- 5
- Shows how the health has changed over time.