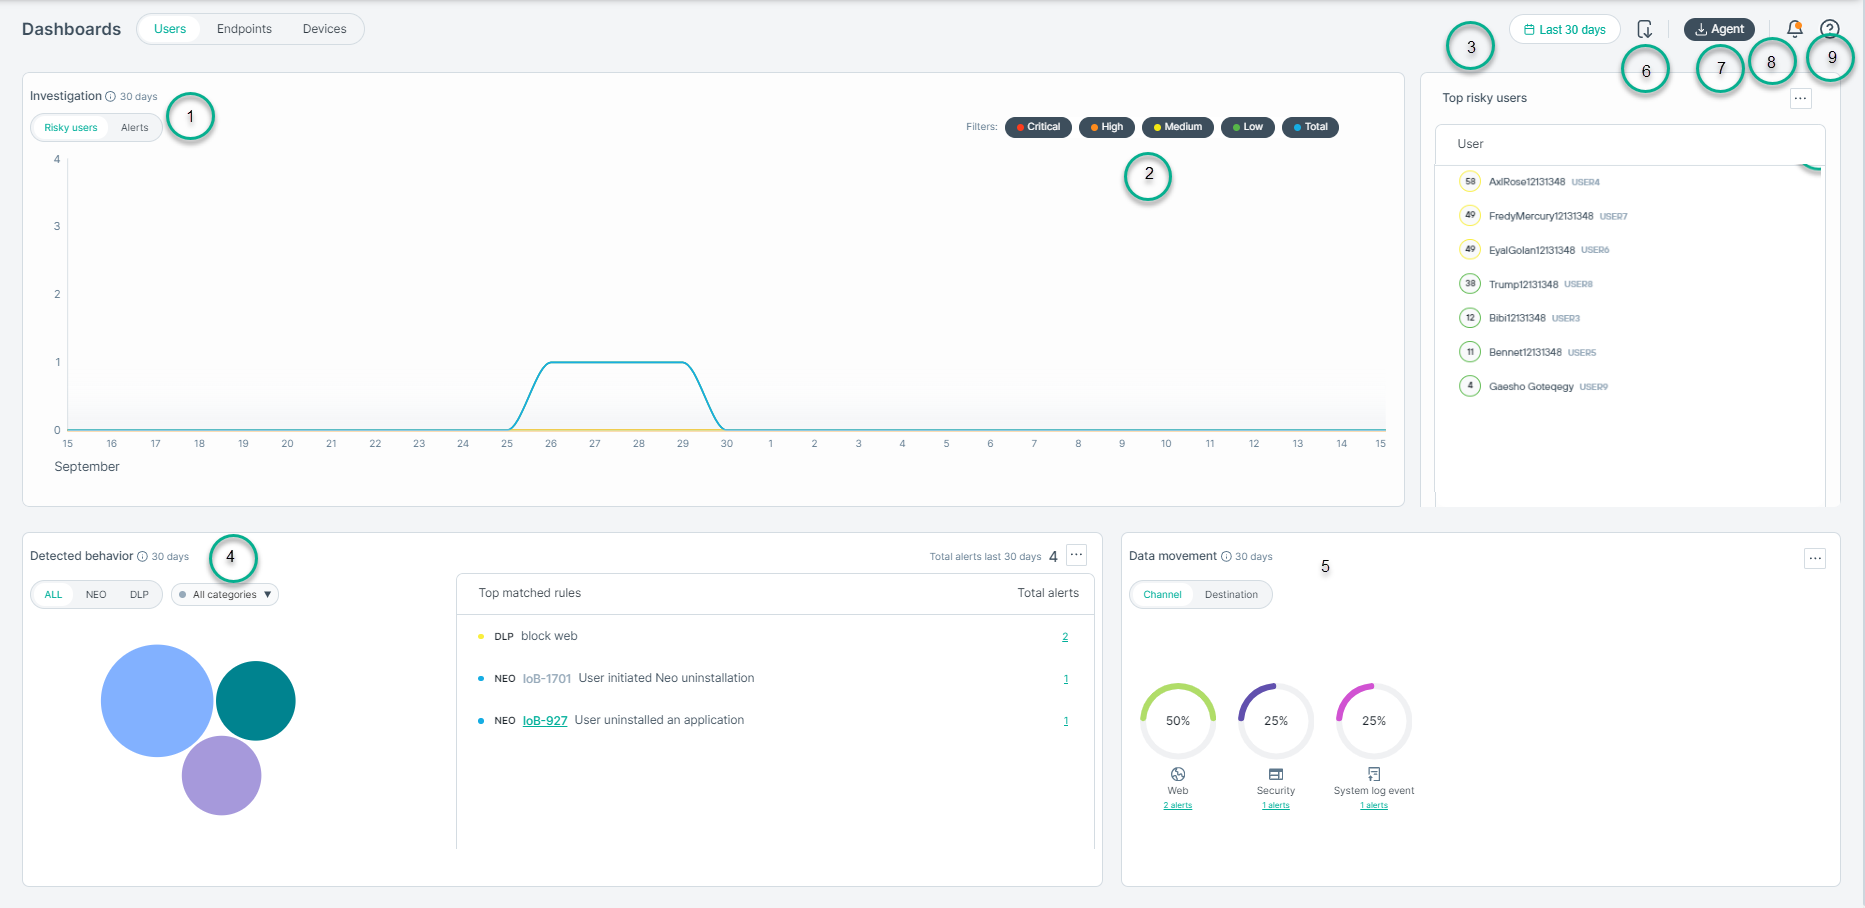
Use the Users dashboard to gain a high-level view of user activities in your organization.

- 1
- Investigation: Click Alerts or Risky users.
- Alerts: Charts the number of alerts generated over the over the past 30 days, 7 days, or 24 hours by severity.
- Risky users: Charts the number of users by risk levels over the past 30 days, 7 days, or 24 hours.
- Hover over the time line to view the risk level breakdown for each day. Select a day to filter the view to that day.
Note: This requires a license that enables User Activity
Monitoring.
- 2
- Filter: Display risky user count filtered by severity- Critical, High, Medium, or Low.
- 3
- Time filter: Click the time filter to view the past 30 days, 7 days, or 24 hours data for all widgets on the dashboard.
- 3
- Top risky users: Lists the top risky end-users in your organization, sorted by risk level and recent activity.
- Click an end-user's name to access the Investigation dashboard for more detailed information.
- You can also download the PDF or CSV format list of the top risky users.
- 4
- Detected behavior: Summarizes the detected behavior of users based on the alerts received during the specified time frame (past 30 days, 7 days, or 24 hours).
- Use the filter to view ALL alerts, NEO (Device Control and User Activity Monitoring) alerts or DLP (Data Protection) alerts. Use the drop down to select specific Alert categories or
Policies.
- The table on the right lists the total alerts by category and the top matched IoBs or DLP rules.
- You can also download the PDF or CSV format list of the top detected risky behaviors.
-
The Users dashboard supports drill down to facilitate the investigation of the behavior behind specific IoBs, alerts, channels or destination. Selecting the link
under the IoB or alert count you wish to investigate will take you to the pre-filtered for the selected behavior, IoB, channel or destination

The Users dashboard now provides links from the Detected behavior widget to the Alerts tab under
Investigation page. Click any specific IoB number from the Detected behavior widget to navigate to the Alerts tab on
Investigation page.
For users logged in as analyst, the user information will be anonymized.
- 5
- Data movement: Displays the movement of your organization's data by destination or channel during the specified time frame.
- Click Channel or Destination to filter by channel or destination. When Channel is selected, click a specific channel to
view all related alerts and destinations.
- You can also download the PDF or CSV format list of data movement by channel and destination.
- 6
- Download: Use the Download button to access the Forcepoint Agent downloads for Windows and macOS.
- 7
- Print as PDF: You can export the complete dashboard details to PDF.
- 8
- Notifications: Update notifications
- 9
- ? (Online Help): Link to access the online help documentation.
Detailed information can also be exported to either a CSV or PDF format report using the  icon on each widget.
![]()
 icon on each widget.