Alerts
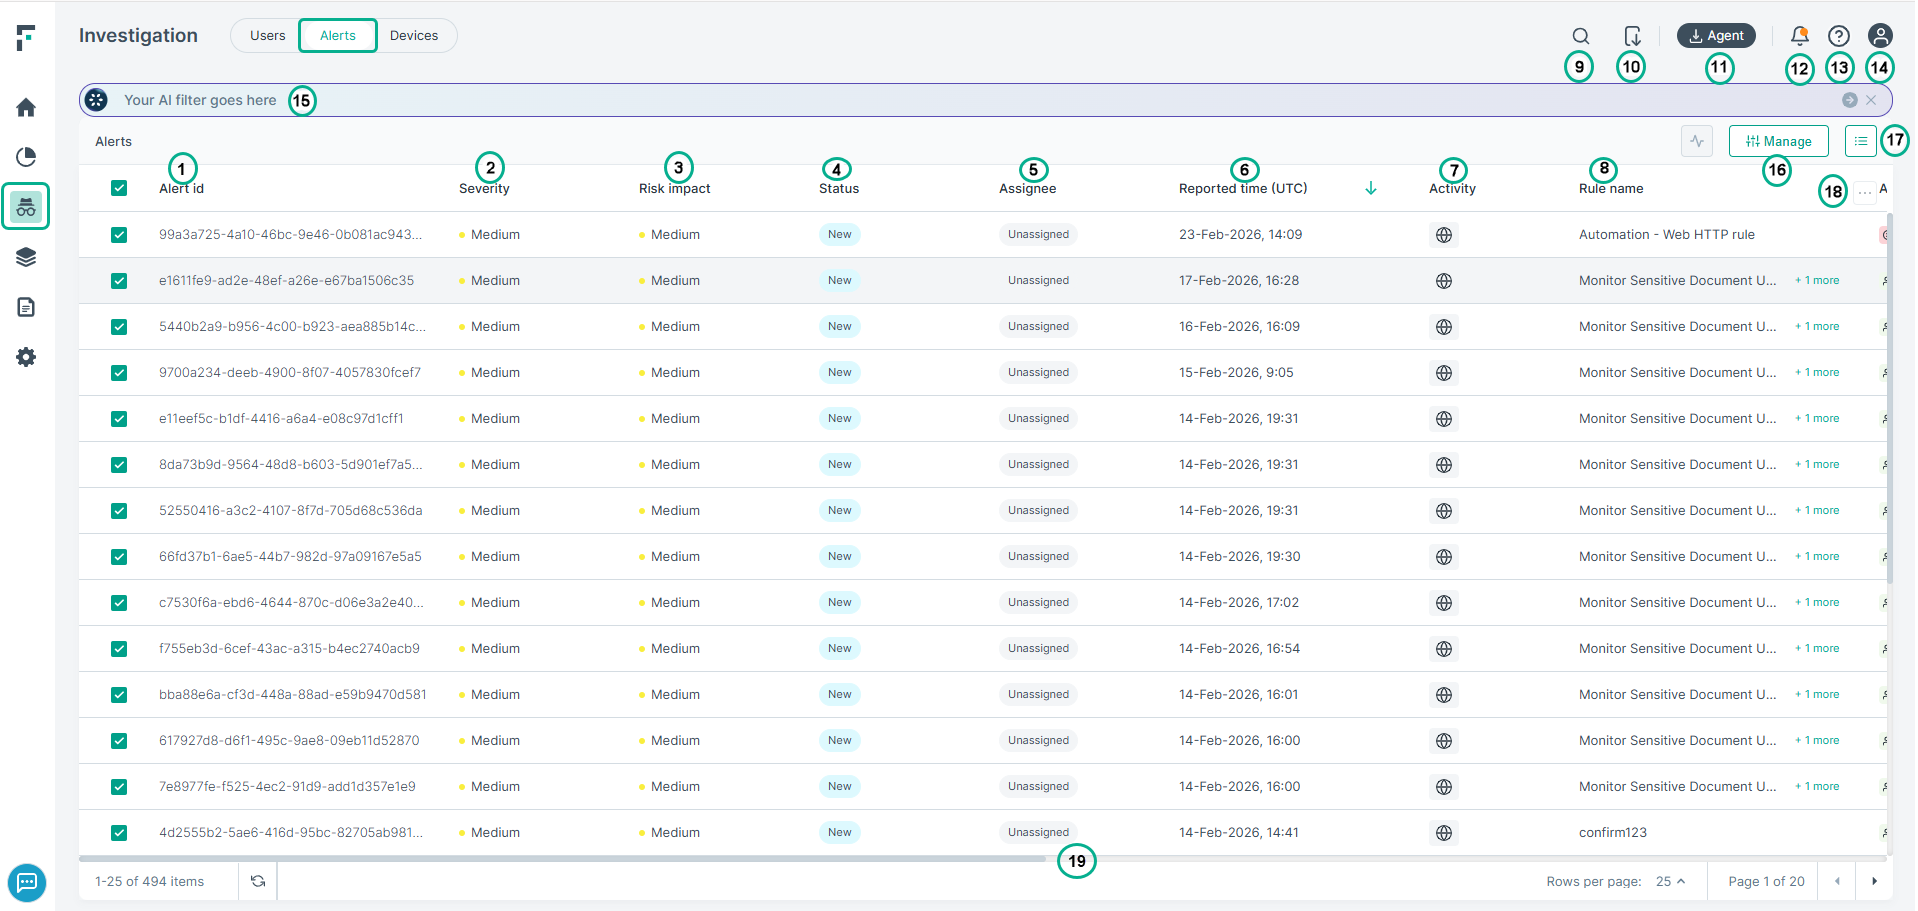
The Alerts tab provides a list view of all alerts recorded within the organization. Each alert appears in a tabular format with information including alert id, severity, risk impact, status, assignee, reporting time (UTC), activity, rule name, action, justification, category, policy, maximum matches, channel, user, and reporting product.
Note: Alerts are retained for 90 days. The order in which alert details appear in the list view may vary and can be customized to suit your needs. You can use the Column selector to modify the
columns.
Below is a description of the available fields and options:
- 1
- Alert id: A unique identifier assigned to each alert.
- 2
- Severity: Indicates the severity level of the alert.
- 3
- Risk Impact: Indicates the associated risk level of the alert.
- 4
- Status: Displays the current status of the alert.
- 5
- Assignee: Displays the user assigned to the alert.
- 6
- Reported time (UTC): Shows the time when the alert was reported, in UTC.
- 7
- Activity: Describes the user activity that triggered the alert.
- 8
- Rule Name: Indicates the rule name that triggered the alert.
- 9
- Search: Enables you to search for a specific user by name.
- 10
- Export to CSV: Allows you to export the alert details into a CSV file.
- 11
- Download Agent: Provides access to download the latest agent version.
- 12
- Notifications: Displays notification messages.
- 13
- Help Icon: Provides access to online documentation and the "What's New" section.
- 14
- Account Information: Displays user account details.
- 15
- AI Filter: Allows you to use the AI assistant to filter alerts. You can use the column names in your table to create filters. For example, show alerts where reported
time is after feb 1, 2026. Note: This feature is currently in limited availability and will be made generally available in the near future.
- 16
- Manage: Provides options to modify the alert status, assignee, and severity.
- 17
- Manage Statuses: Allows you to add or edit custom statuses.
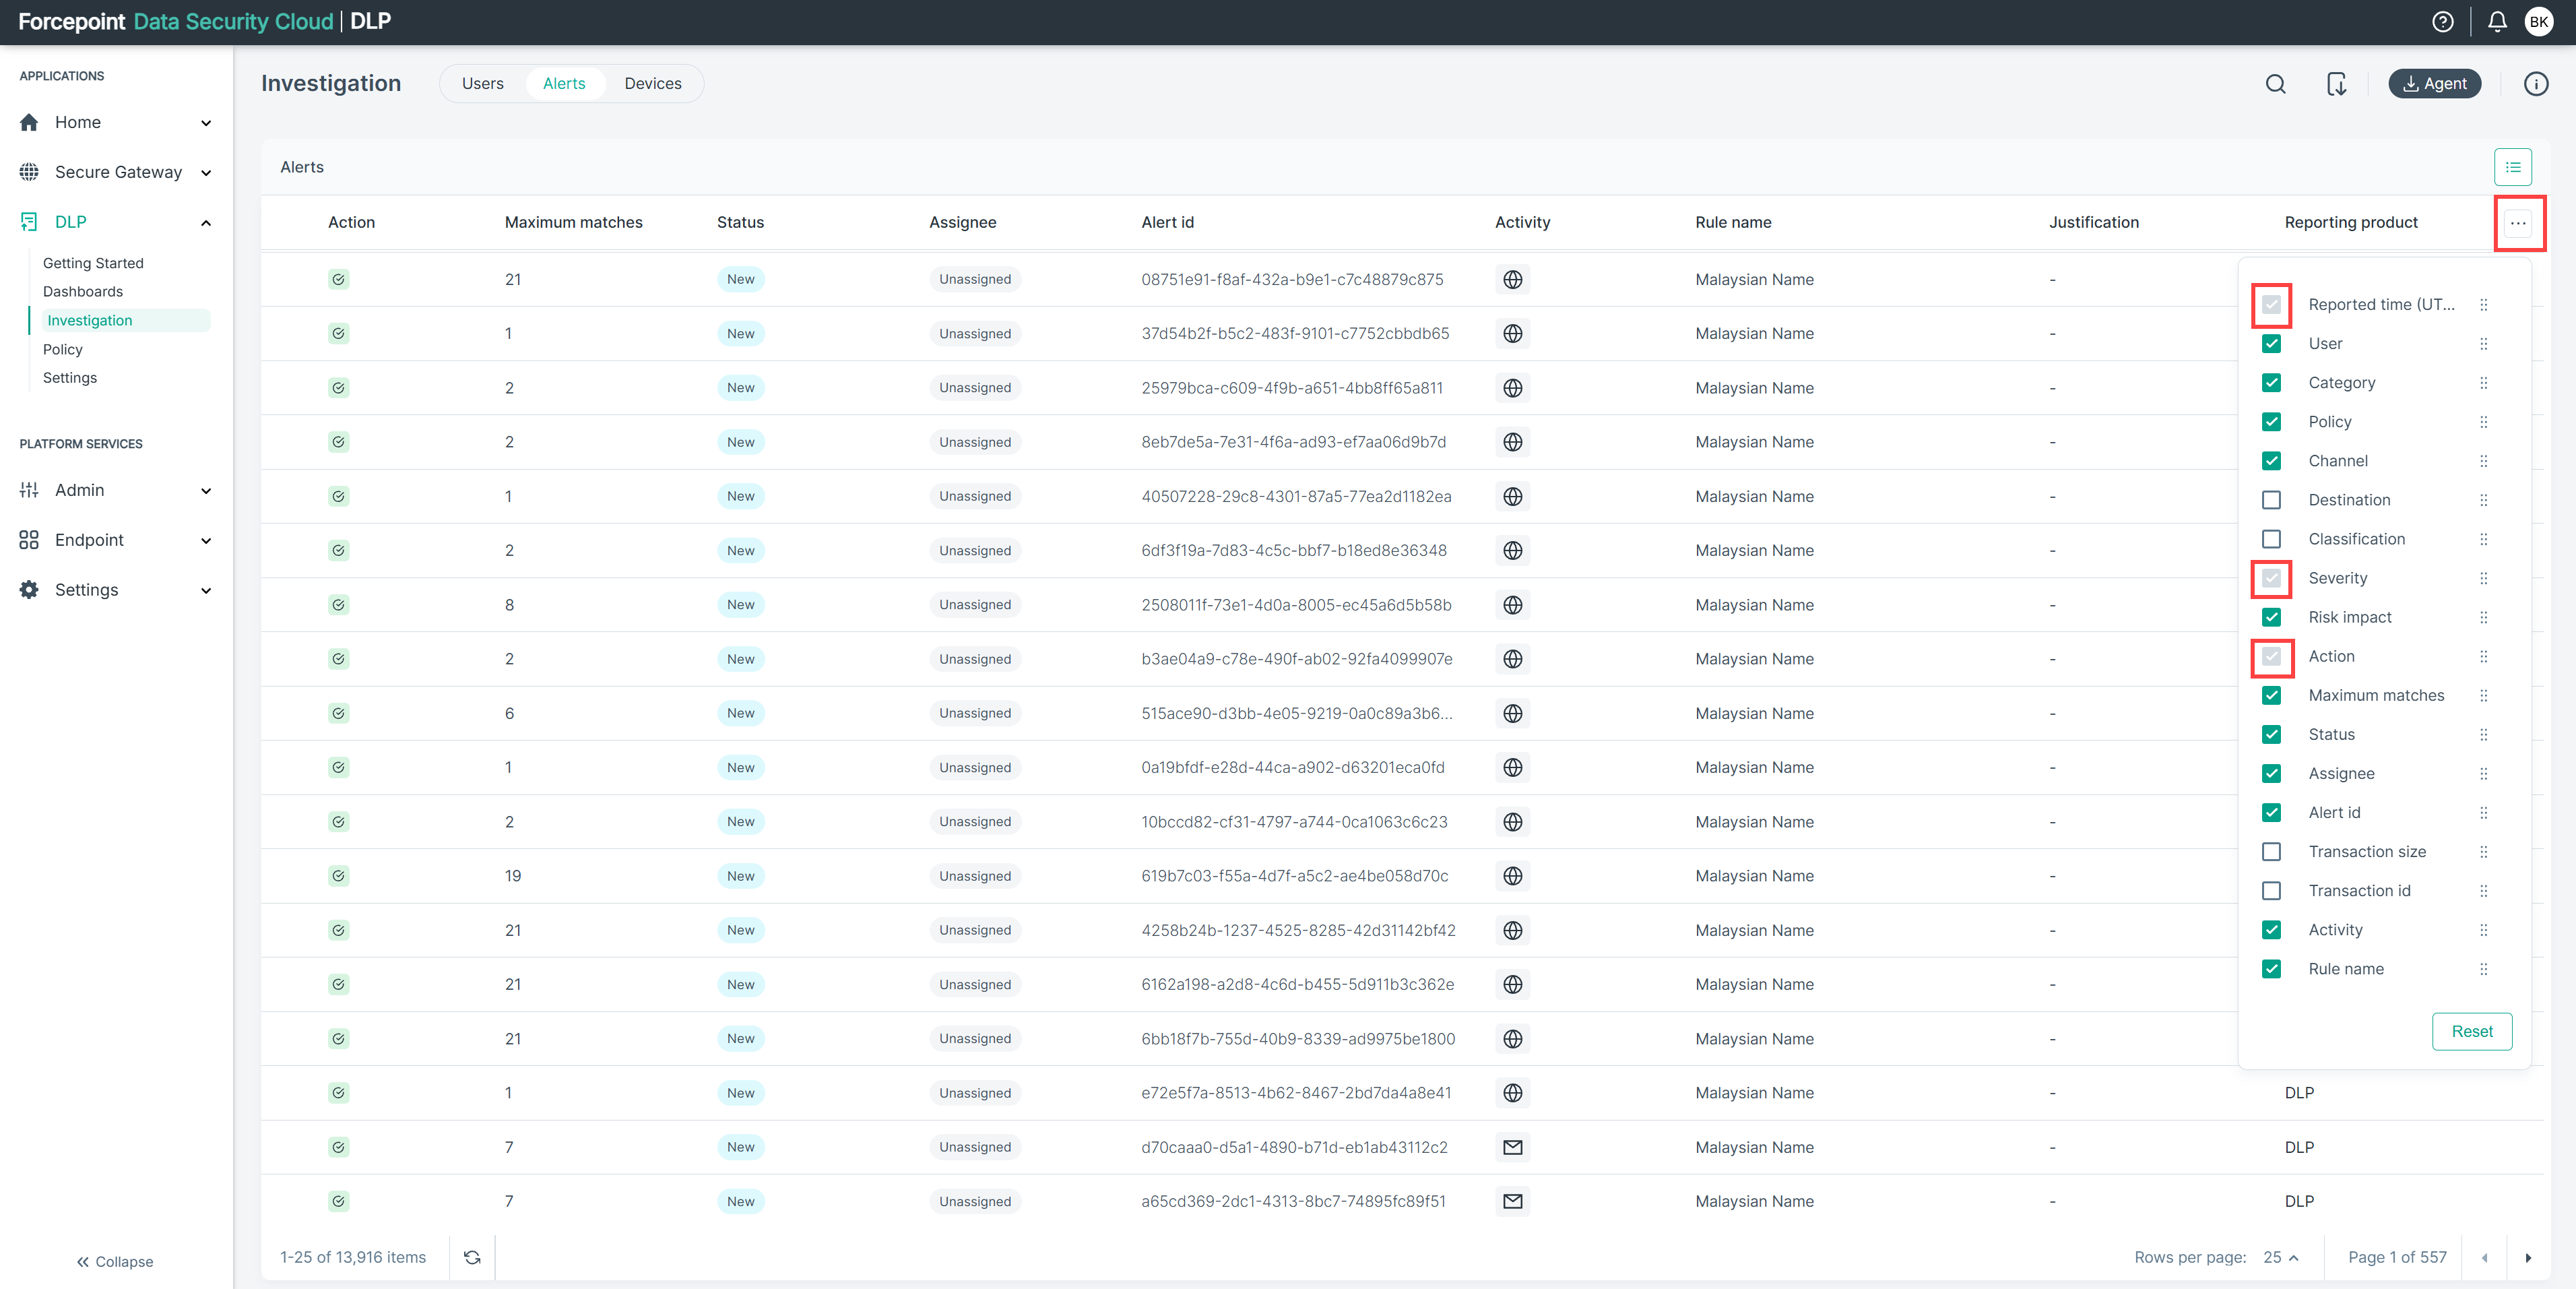
- 18
- Column selector: Allows you to configure which columns are displayed in the table. The order in which alert details appear in the list view can be customized to suit your needs. Click the Column selector to modify the columns. You can drag and drop fields to reorder them and select or unselect optional fields according to your requirements.
-
- 19
- Bottom Slide Bar: Allows you to view the other columns available in the table (list view).
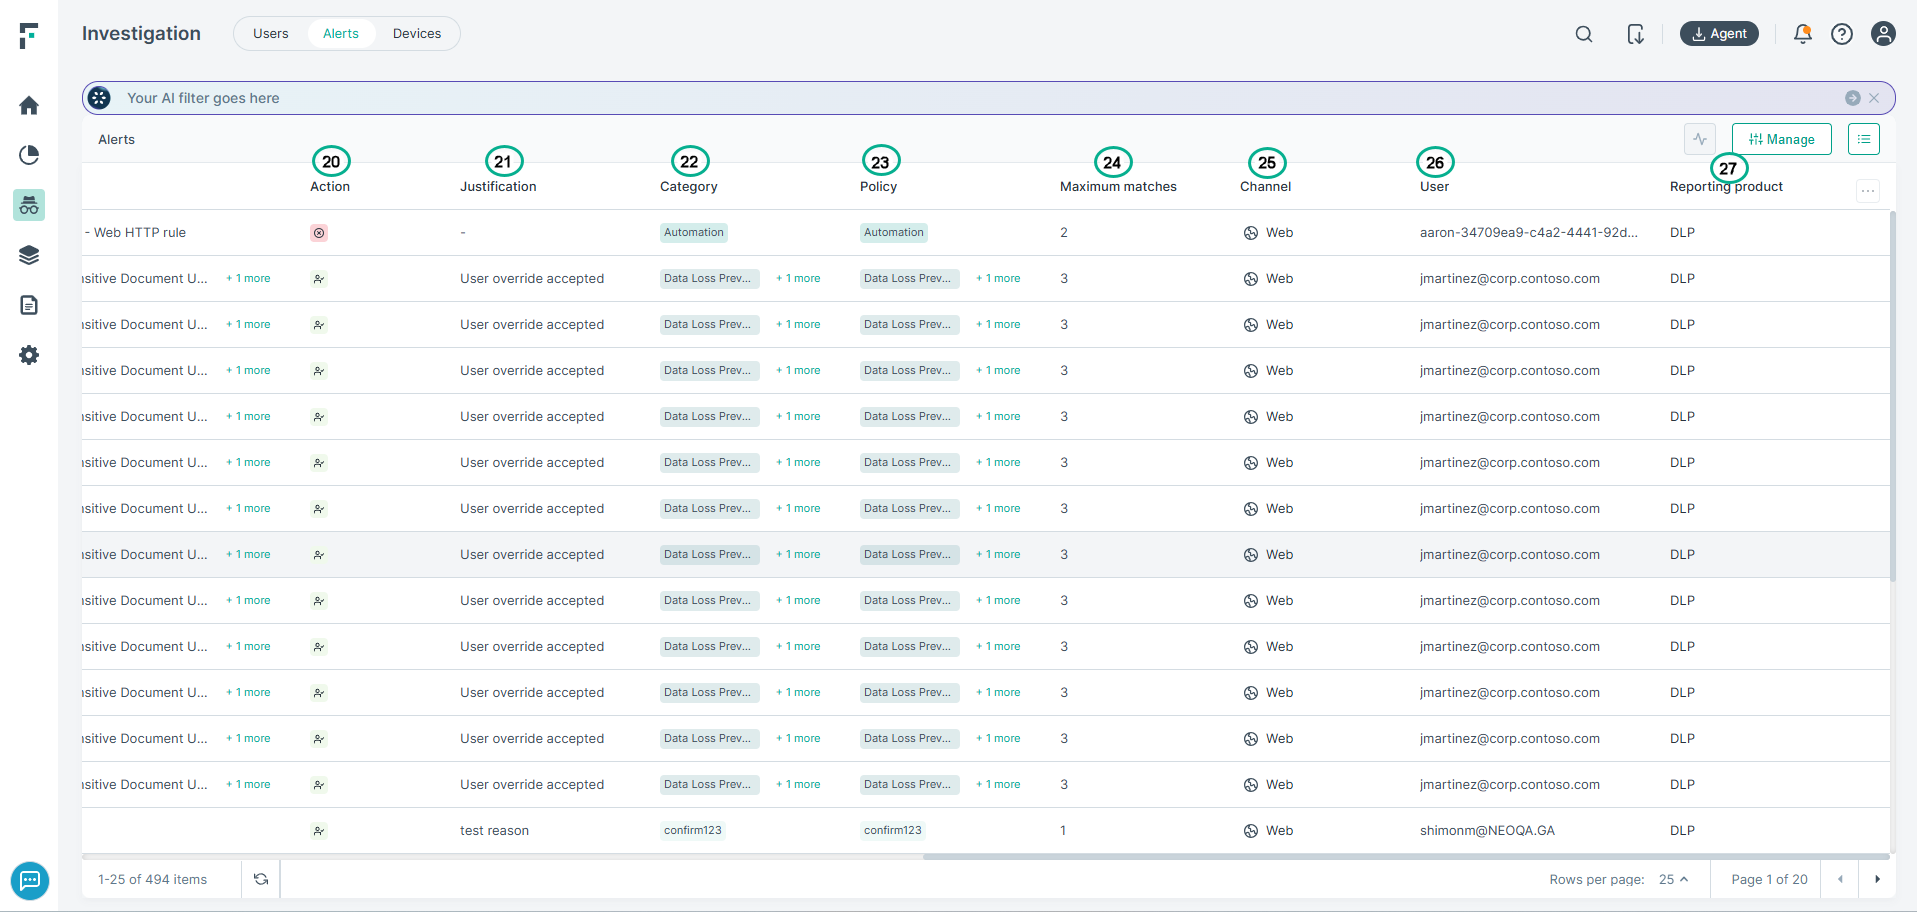
- 20
- Action: Displays the action that was taken by the system. For example, allow or block.
- 21
- Justification: Shows the justification reason the user provided to proceed with the action despite the alert. Note: When an action violates policy in the F1A agent, an alert is generated. To continue with the action, the user must provide a reason in the Coaching Dialog, and that reason is shown here under justification.
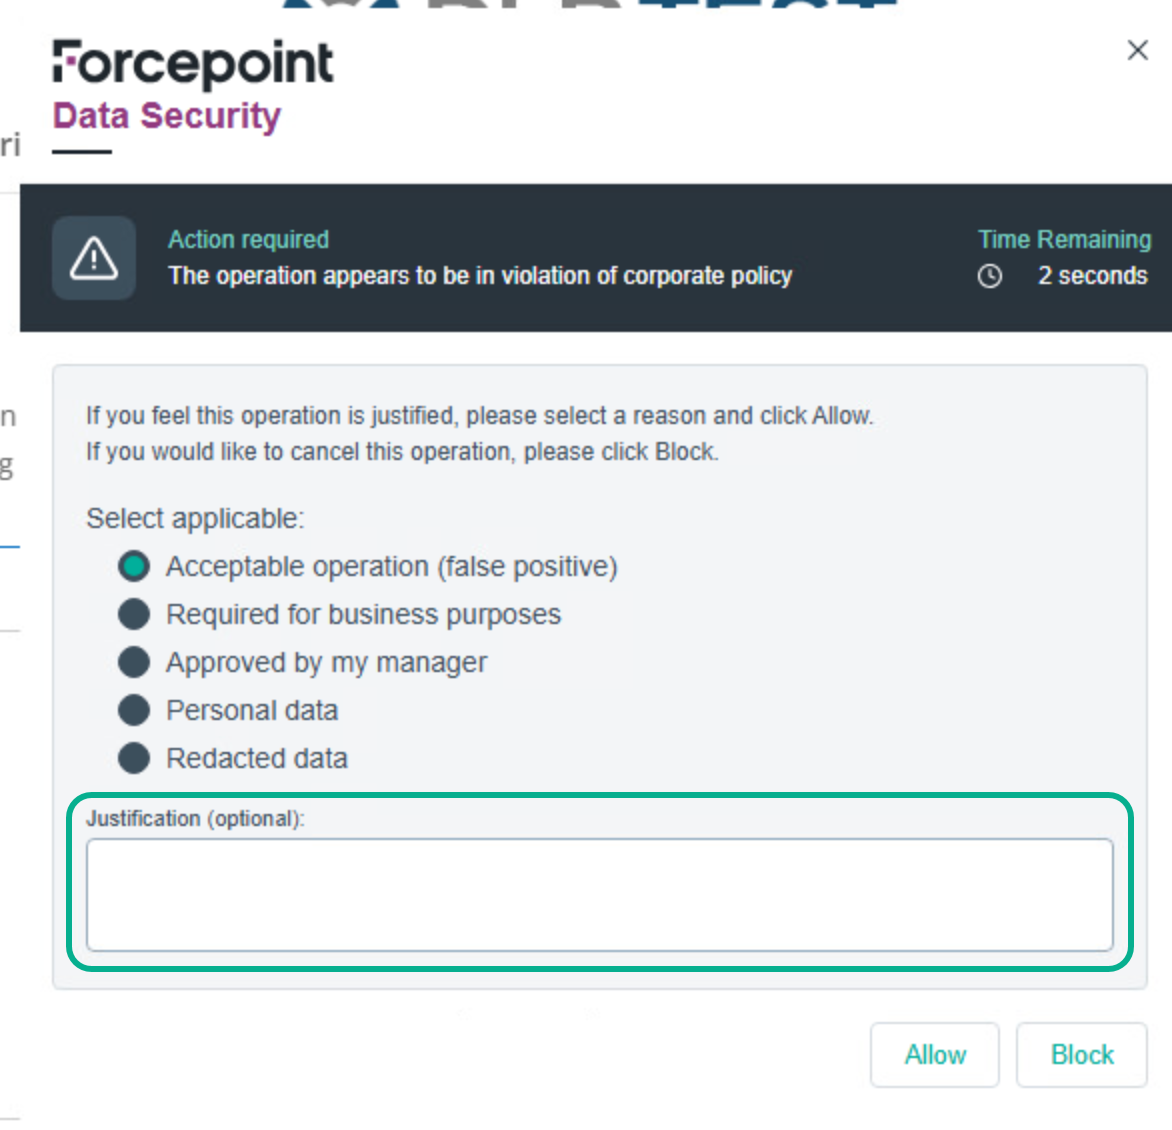
- 22
- Category: Indicates the category of data breach. For DLP Alerts the category is equivalent to the matched DLP policy name.
- 23
- Policy: Shows the name of the policy that was matched. If more than one policy matches, the number of additional policies is displayed, and users can click it to view the additional policy names.
- 24
- Maximum matches: Indicates the maximum number of violations triggered by any given rule in the incident.
- 25
- Channel: Indicates the channel used by the specific user activity that led to the alerts.
- 26
- User: User performing the activity that generated the alert.
- 27
- Reporting product: Shows the product that was used to monitor and report the user activity. DLP indicates it is primarily an alert originating from the configured data protection policy, while Neo indicates it is an alert originating from either the configured device control or user activity monitoring rules.
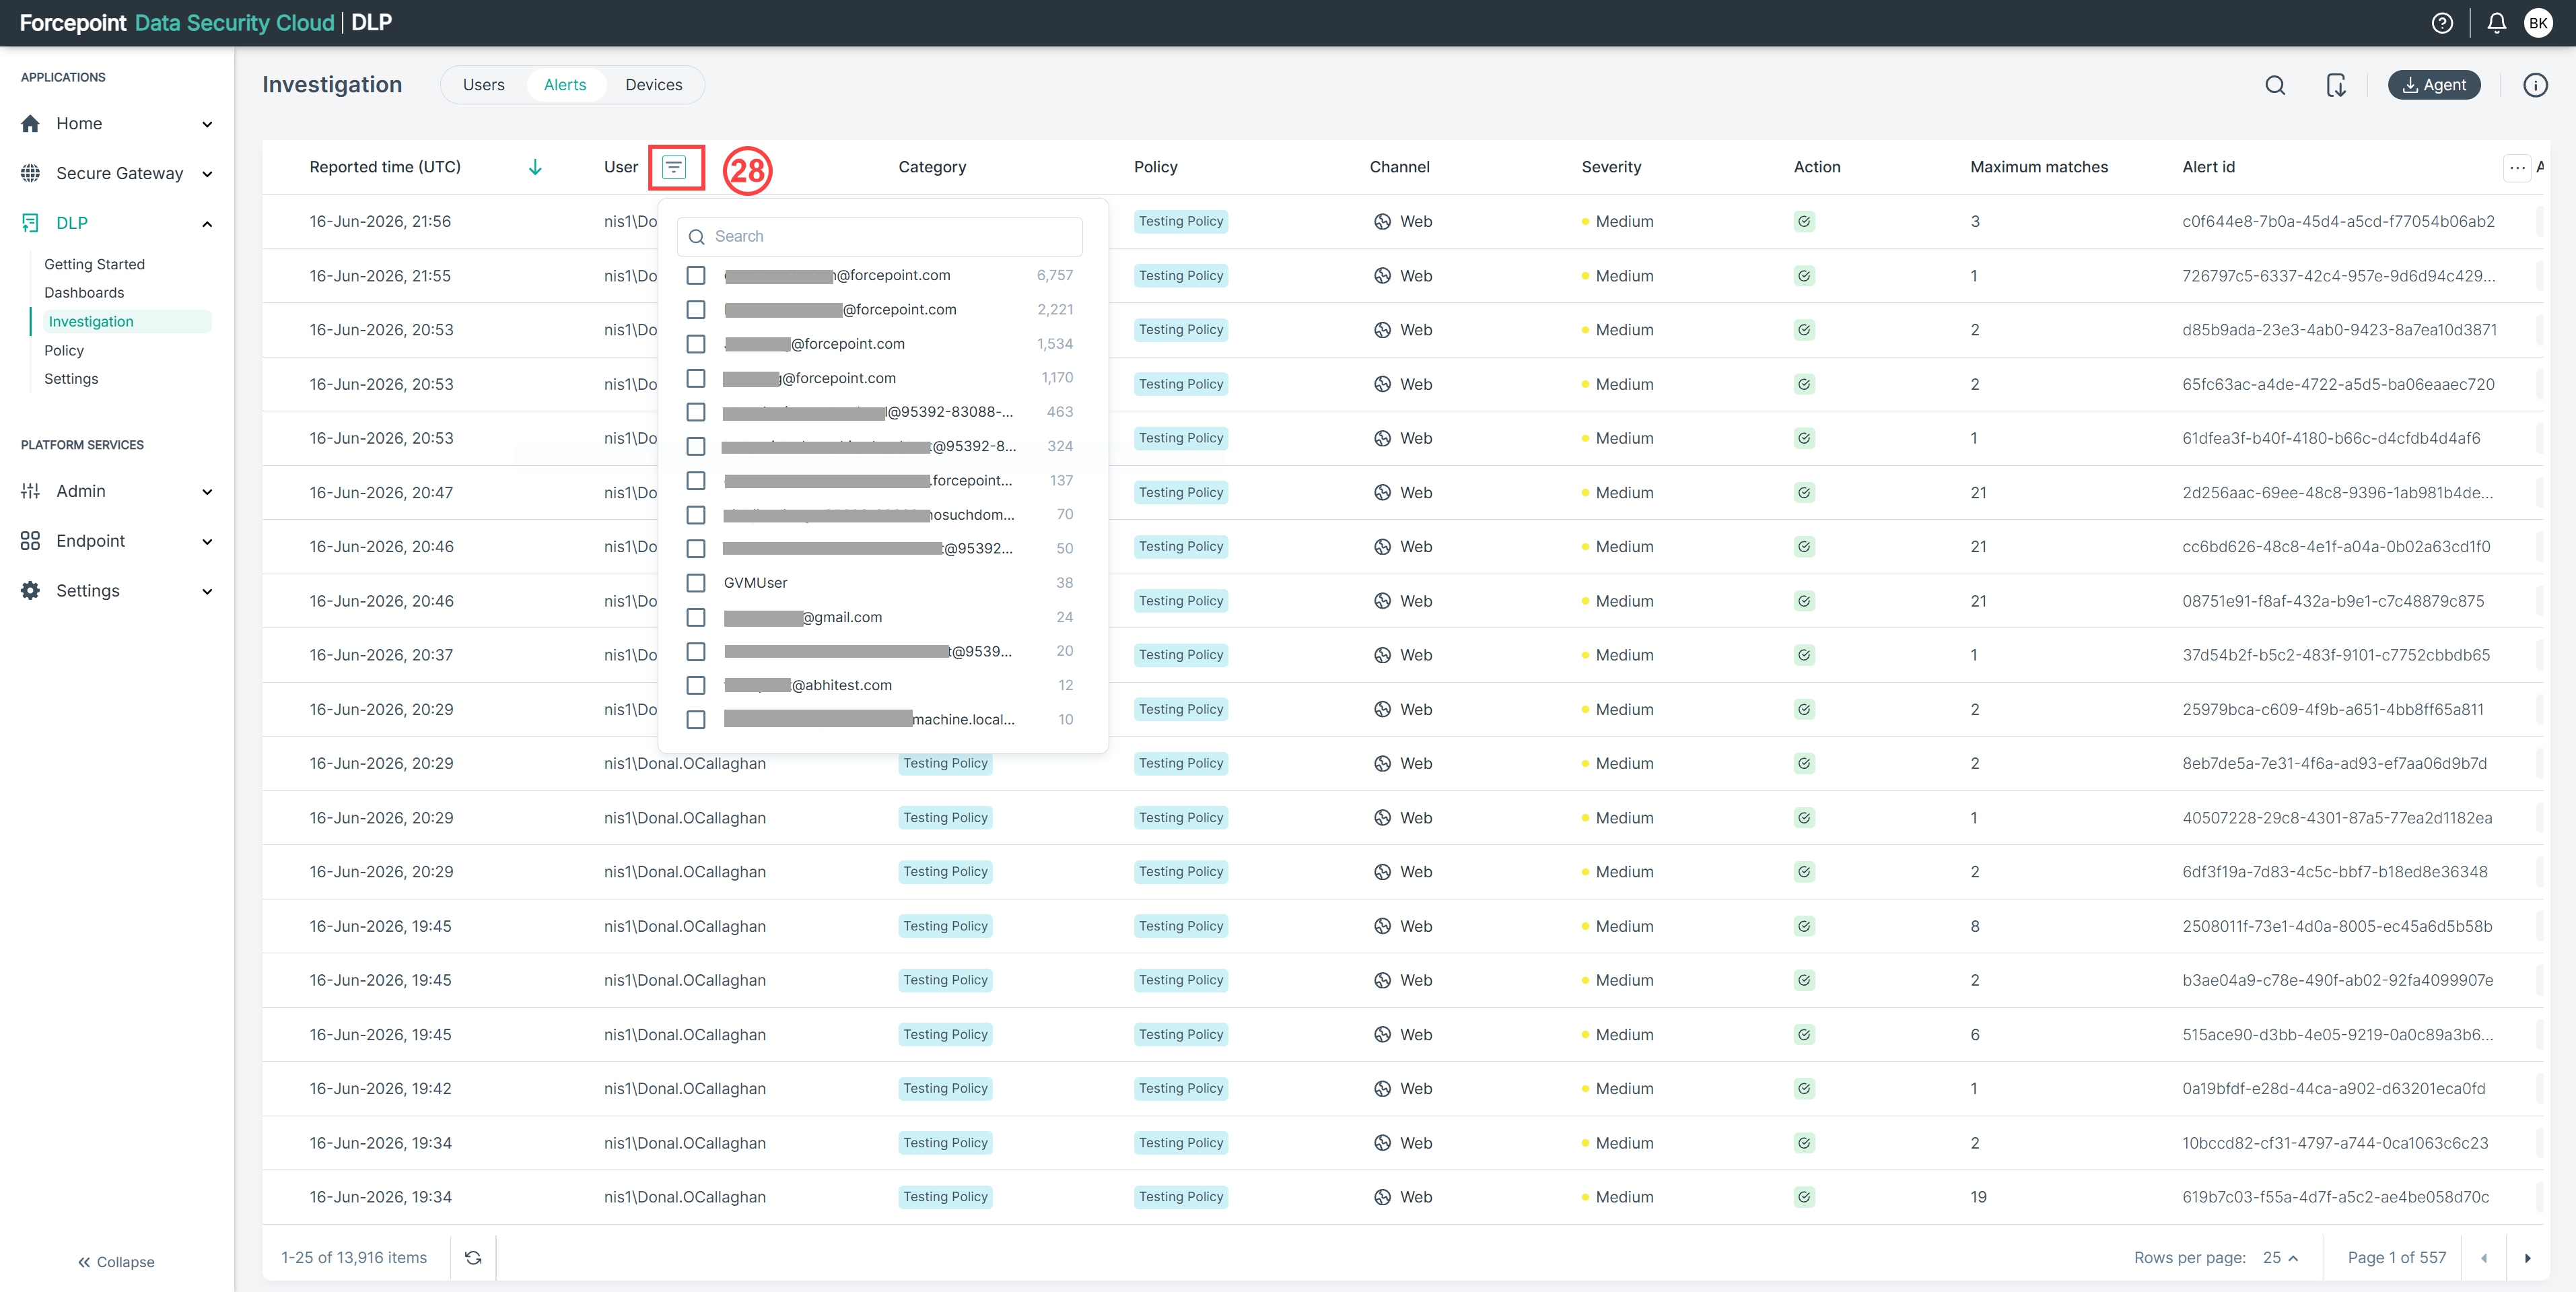
- 28
- Filter: The Alerts tab also includes filtering capabilities. You can filter alerts based on the following columns: Alert id, Severity, Risk Impact, Status, Assignee, Reported time (UTC), Activity, Rule name, Action, Category, Channel, User, Destination, Classification and Reporting product. Hover over the desired field to reveal the Filter icon. Click on it and select your requirements from the drop-down menu. The system will automatically filter the results based on your selections.
-