Step12: View event information on the Forcepoint Data Security Cloud | SSE
You can review the incidents by viewing and managing logs for the Cloud Applications on Forcepoint Data Security Cloud | SSE.
Proxy Logs and API Logs
Following logs can be found under :
-
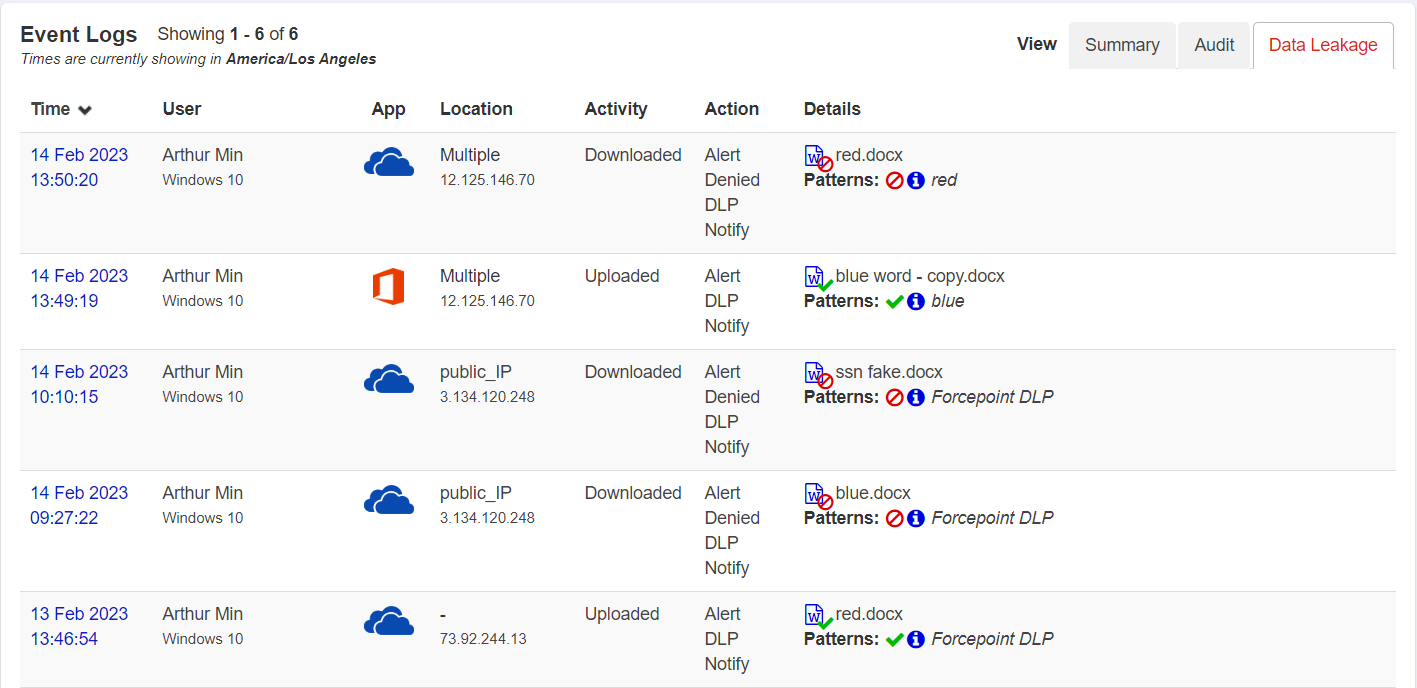
Proxy Logs: The Proxy Logs are where admins go to review all user activity (events/logs/etc) in all protected applications associated with inline access control and DLP policies. Event Logs section displays every transaction related to your SaaS application and data in-line through the proxies.
-
API Logs: The API Logs provides visibility into data at rest in cloud applications integrated via API. Forcepoint Data Security Cloud | SSE scans all files to categorize them for public, external, internal and private files and identifies the files matched against DLP patterns to provide a summarized interactive dashboard. This makes it easier for the admin to know if any sensitive corporate data exists in the cloud application or is shared outside the organization.
The Audit view displays the User Activity performed on the file and/or DLP Action taken on the file. Audit view displays result of every scan.
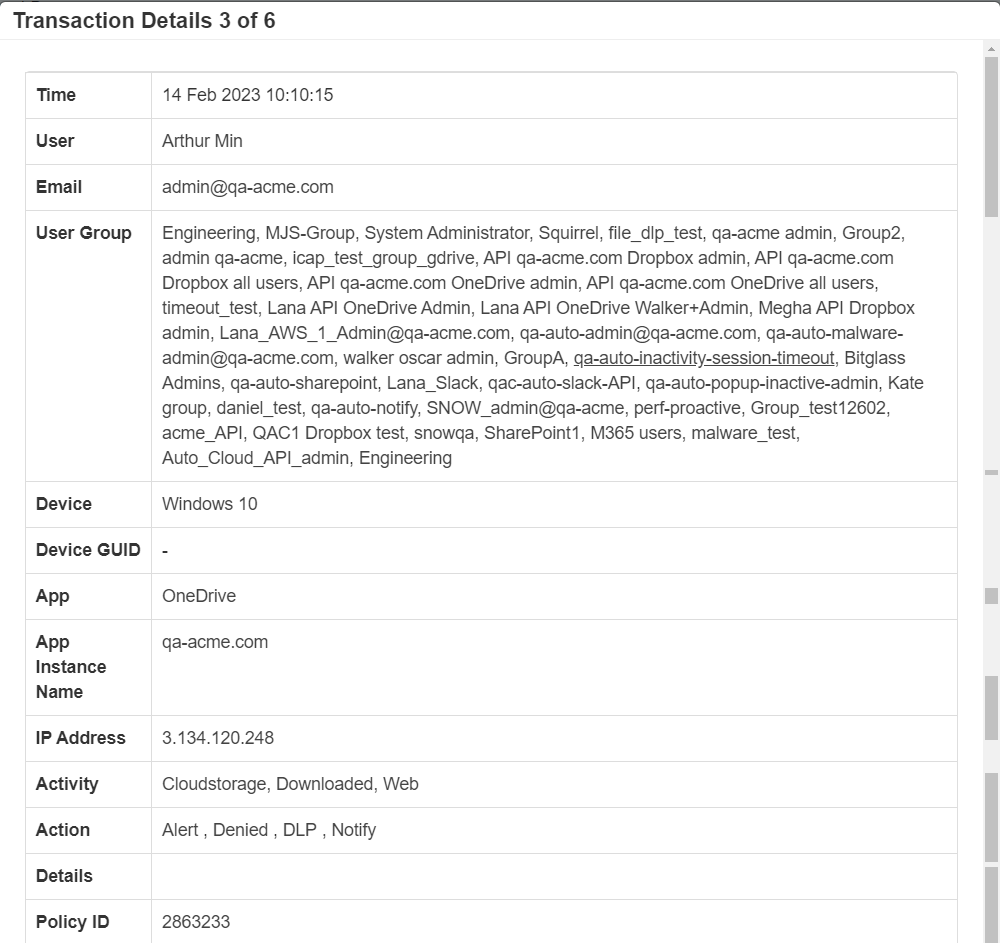
After accessing the Proxy Logs or API logs page, under Event Logs section, you can click the time stamp of the log to view the log details as shown below.
Log details:
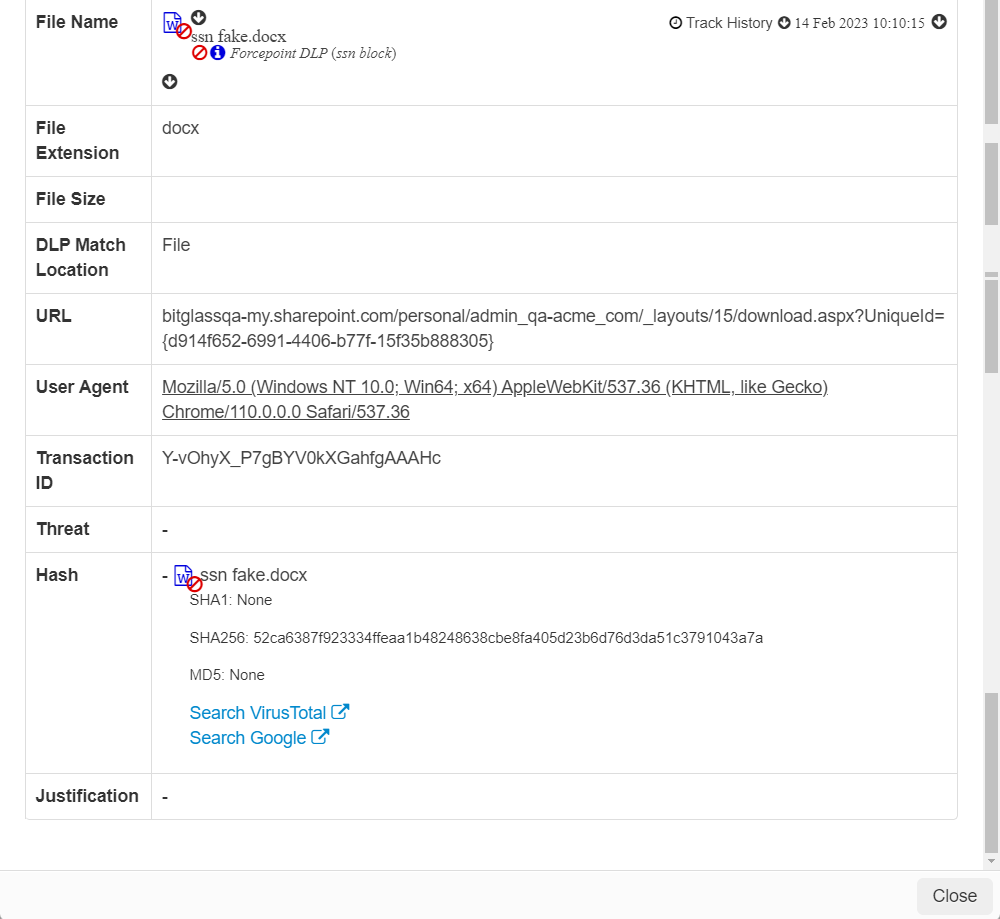
When FSM returns the action, then the Data Pattern displays Forcepoint DLP in the log for matched files.
To know more about Proxy Logs and API logs, refer to Reviewing Proxy logs and Reviewing API logs respectively.
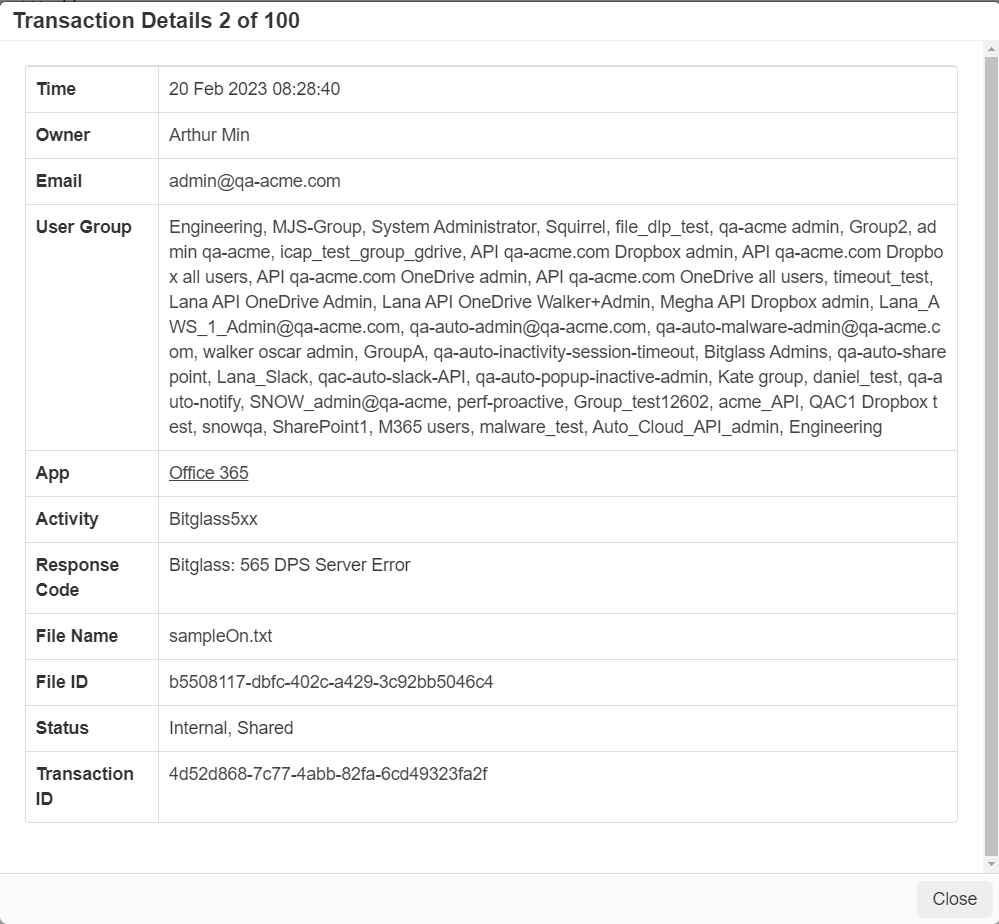
Health Logs
The Health logs allows admins to identify if issues that users encounter are brought on by Forcepoint Data Security Cloud | SSE or the backend server. You can access the Health Logs by navigating to .
The system health logs should have record when ever FSM returns a response other than 2xx code.
To know more about Health logs, refer to Reviewing Health logs.