Reviewing Health logs
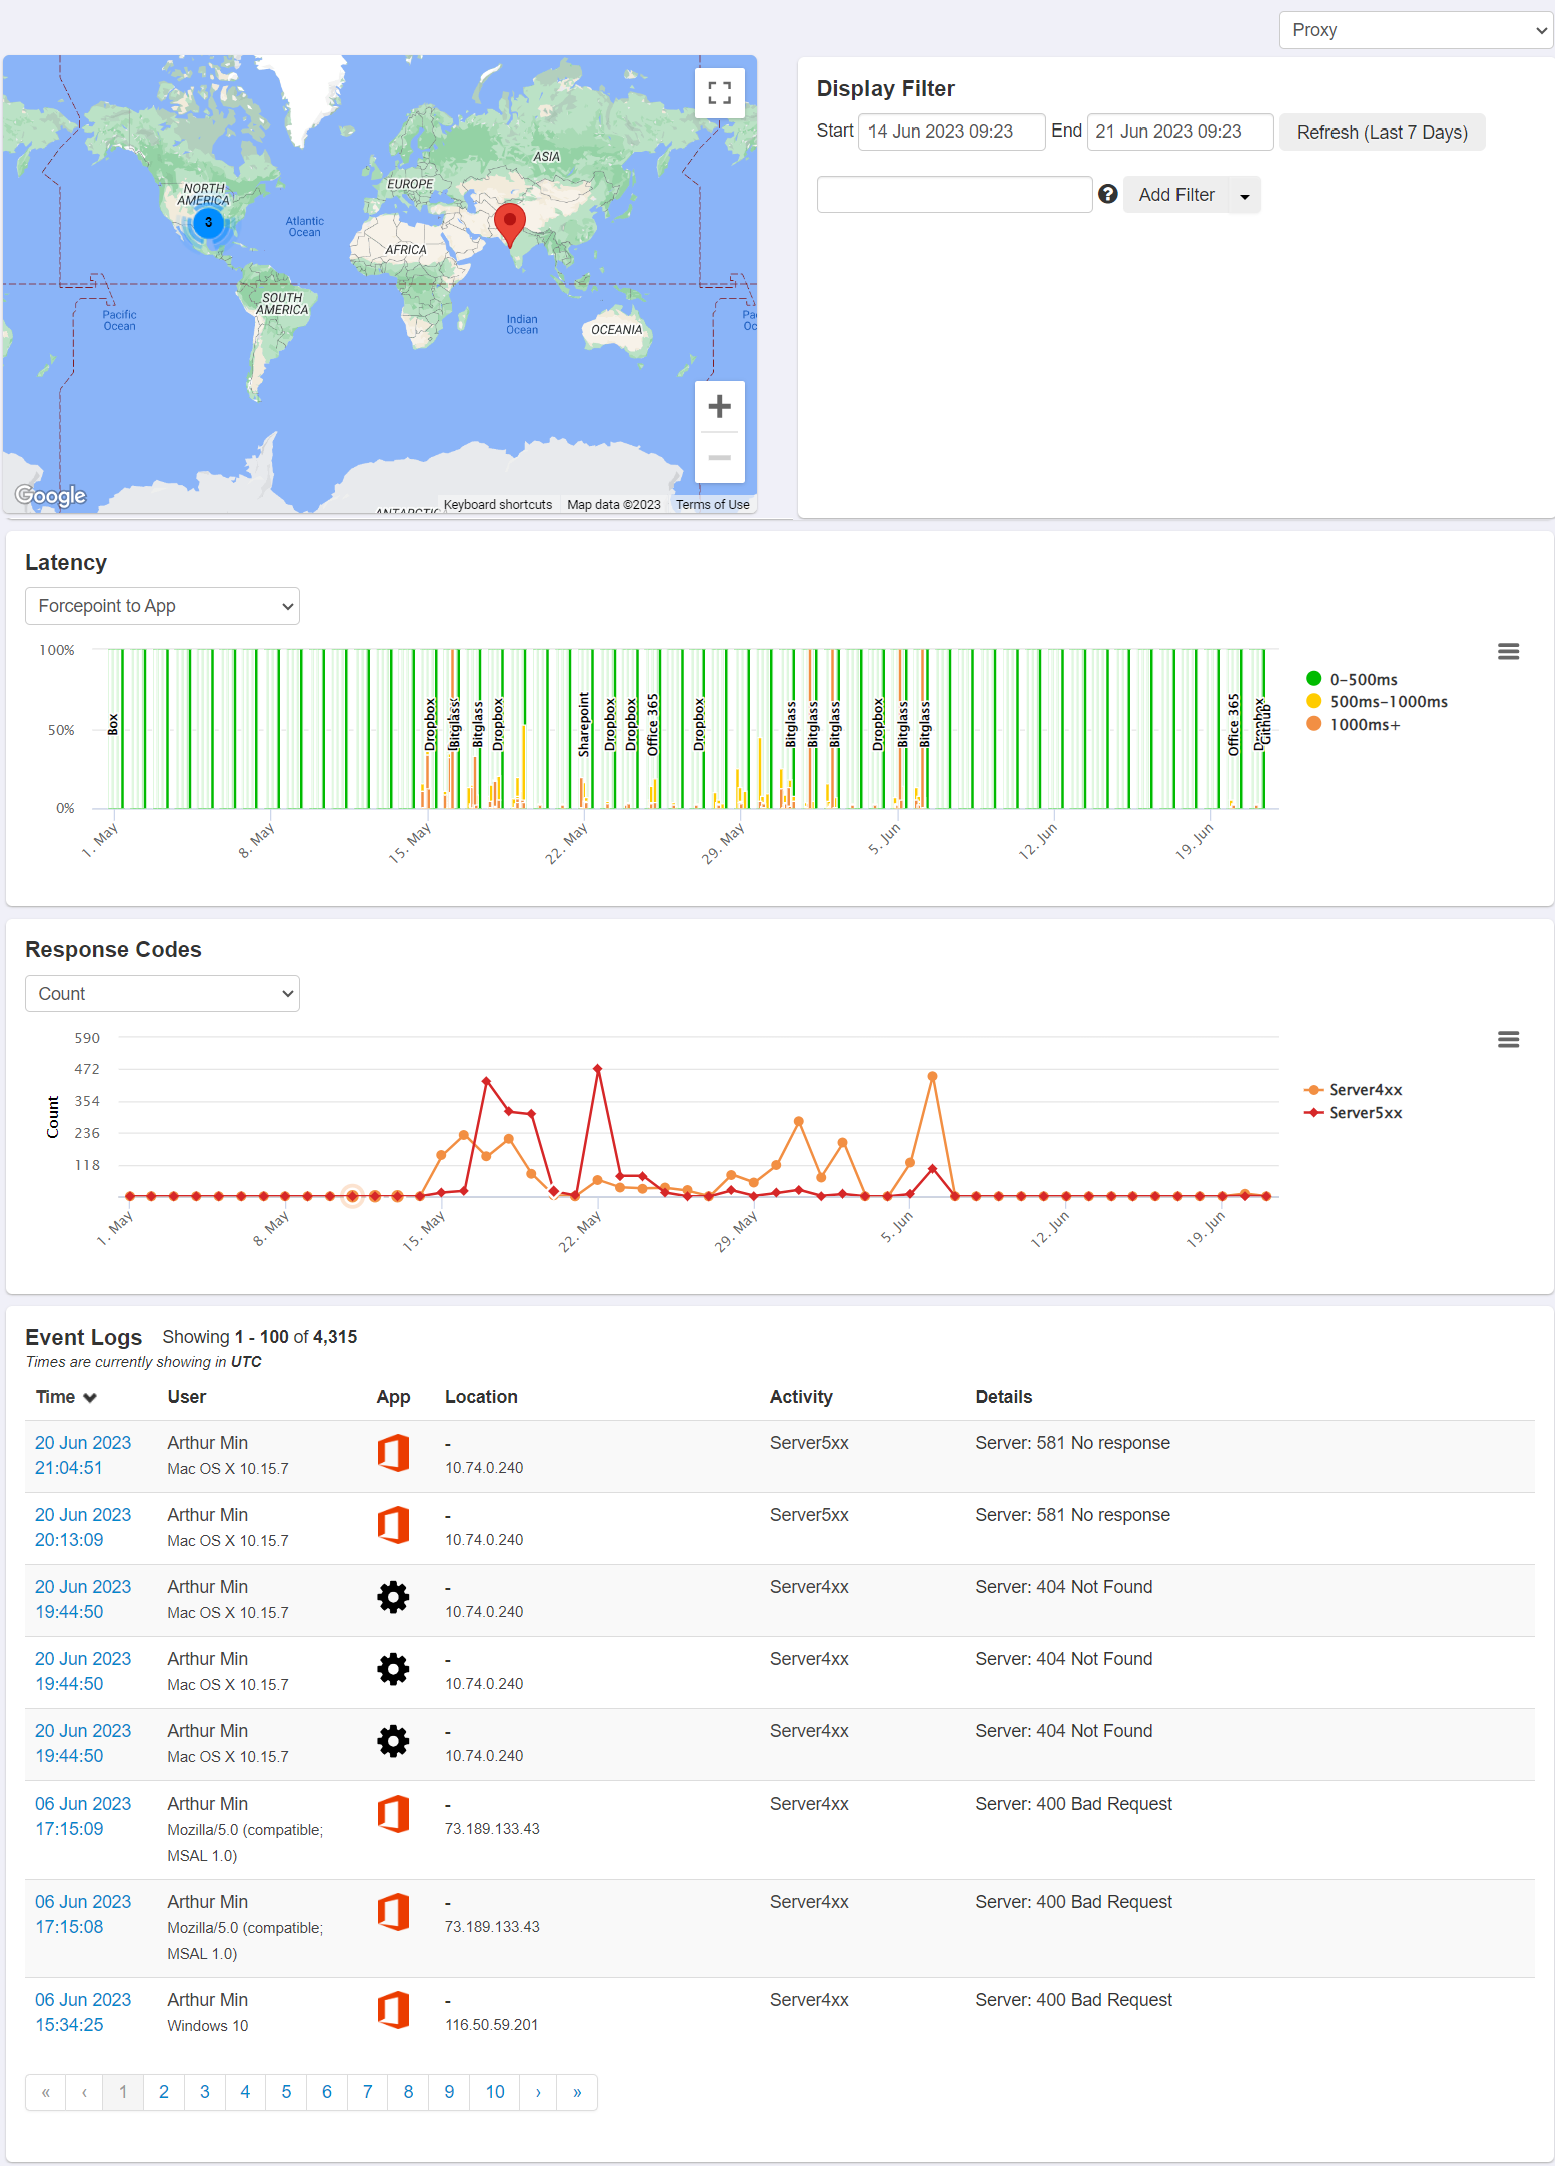
The Health dashboard allows admins to identify if issues that users encounter are brought on by Forcepoint Data Security Cloud | SSE or the backend server (example: Google, Exchange, Salesforce, etc).
The dashboard graphs error codes to quickly view the type and source of issues that have been generated as well as a customizable filter to help sift through the results. You can access the System Health Logs by navigating to .
The Health dashboard is broken down into three tabs:
- The Proxy tab displays response codes and latency time inline.
- The API tab displays any API related errors received from the cloud application.
- The Health tab pinpoint issues with your setup or within your cloud applications.
