You can automate the log collection using the Rsyslog. This topic covers how to automate log collection using the Rsyslog.
Before you begin
Before you proceed in configuring Rsyslog, you will need to make sure you meet the following requirements:
- Logs must be sent to syslog.bitglass.com over TCP port 1999.
- Logs must be sent utilizing TLS 1.2 with client authentication as a primary method of tenant identification.
Rsyslog method is useful for TCP based firewalls - such as Zscaler's NSS.Follow the steps below to configure Rsyslog:
Steps
-
Run the yum install rsyslog rsyslog-gnutls rsyslog-gssapi command.
Running
sudo yum info rsyslog should give you the following
results:
Installed Packages
Name : rsyslog
Arch : x86_64
Version : 8.24.0
Release : 12.el7
Size : 1.9 M
Repo : installed
-
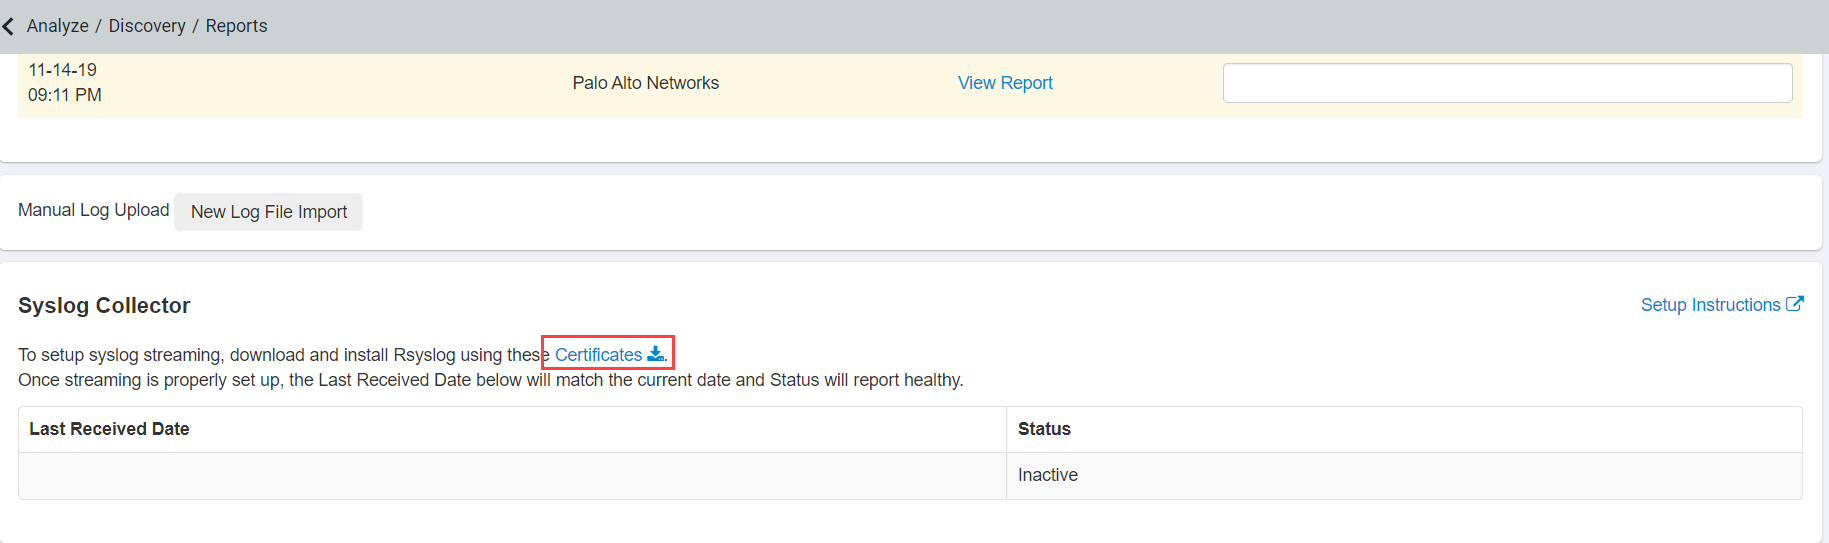
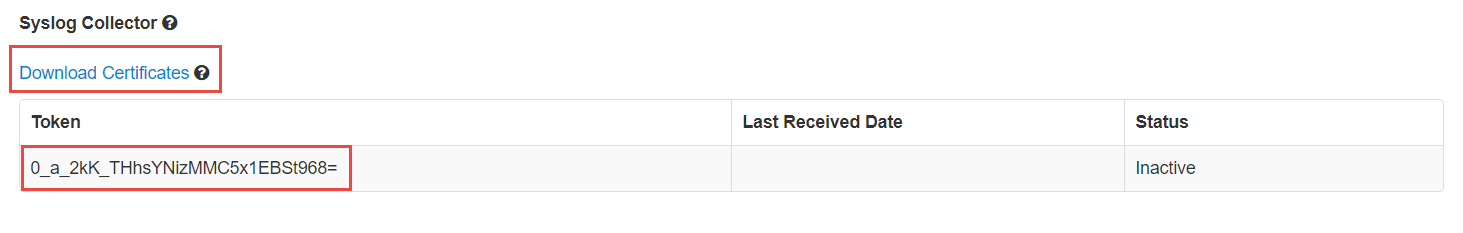
Download the zip file containing the client certificates and copy the unique token from the Forcepoint Data Security Cloud | SSE.
-
Unzip the certificate and keys and then do the following:
-
Create a file named chain.crt and copy/paste the root certificate first and then the intermediate.
The root certificate will be listed as SHA2SecureServerCA.pem, the intermediate certificate will be listed as
DigiCertGlobalRoot.pem.
-
Keep the client certificate and key in separate files and rename them to client.crt and client.key respecitvely.
-
Copy the files to /etc/rsyslog.d/ (alternatively, you can copy the files to another location as long as the rsyslog service has access to the files as
the user it is running under.)
-
Now you can setup the configuration file for rsyslog.
-
In the example below, rsyslog will listen for all log sources on UDP port 514, then stream them to Forcepoint Data Security Cloud as a single log. The
certificates and key from step 2 are specified by the following lines:
- $DefaultNetstreamDriverCAFile /etc/rsyslog.d/chain.crt
- $DefaultNetstreamDriverCertFile /etc/rsyslog.d/client.crt
- $DefaultNetstreamDriverKeyFile /etc/rsyslog.d/client.key
-
The template that complies to RFC23 while appending the Forcepoint Data Security Cloud | SSE token is specified by the line below. Be sure to replace
<Token ID> with the value you recorded in step 2.
template(name="BitglassFormat" type="string" string="<%PRI%>1 %TIMESTAMP:::date-rfc3339% %HOSTNAME% %APP-NAME% %PROCID% %MSGID% %STRUCTURED-DATA% <Token ID> %rawmsg%\n")
-
A local file to read from and send to Forcepoint Data Security Cloud | SSE is specified by the following line:
- $InputFileName /tmp/static_file.log
-
Rsyslog needs a file to buffer logs and use as a scratchpad for operations. The following line specifies the location it has access to read and write to:
- $WorkDirectory
/var/lib/rsyslog
sudo vim /etc/rsyslog.conf
#### rsyslog 8.32.0 configuration file ####

#### MODULES ####
#$ModLoad imuxsock
#$ModLoad imtcp
$ModLoad imudp

#### Global Directives ####
# SSL files required for authentication #
$DefaultNetstreamDriverCAFile PATH/chain.crt
$DefaultNetstreamDriverCertFile PATH/client.crt
$DefaultNetstreamDriverKeyFile PATH/client.key

# TLS Setup #
$DefaultNetstreamDriver gtls
$ActionSendStreamDriverMode 1
$ActionSendStreamDriverAuthMode x509/name
$ActionSendStreamDriverPermittedPeer *.bitglass.com

# Set the default permissions for all log files. #
$FileOwner syslog
$FileGroup adm
$FileCreateMode 0640
$DirCreateMode 0755
$Umask 0022
$PrivDropToUser syslog
$PrivDropToGroup adm

# Enable Logging #
#$DebugFile /etc/rsyslog.d/rsyslog.log
#$DebugLevel 2
# Auxiliary file storage location #
$WorkDirectory /var/spool/rsyslog

$ActionQueueFileName fwdRule1
$ActionQueueMaxDiskSpace 1g
$ActionQueueSaveOnShutdown on
$ActionQueueType LinkedList
$ActionResumeRetryCount -1

#### LOG SOURCE ####
# Listen for steaming logs coming in on UDP port by default. #
# To switch to TCP, uncomment TCP directives and comment UPD ones. #

$RuleSet bitglass
#$RulesetCreateMainQueue on
# Bitglass template for compliance to IETF’s protocol-23 format plus unique Bitglass identifier #
template(name="BitglassFormat" type="string" string="<%PRI%>1 %TIMESTAMP:::date-rfc3339% %HOSTNAME% %APP-NAME% %PROCID% %MSGID% - 0__QPEXasHCxwF2Adw== %rawmsg%\n")

### The above token number "0__QPEXasHCxwF2Adw==" should be replaced with your token number from your Forcepoint Data Security Cloud | SSE tenant found on the Discovery page.###

*.* @@(o)syslog.bitglass.com:1999;BitglassFormat

$InputUDPServerBindRuleset bitglass
$UDPServerRun 514

#$InputTCPServerBindRuleset bitglass
#$InputTCPServerRun 514

$RuleSet RSYSLOG_DefaultRuleset

#### End of rsyslog configuration file. ####
-
If you would rather pickup logs from a file instead of listening on UDP port 514, perform the following steps.
-
Remove the following lines:
- $UDPServerRun 514
- $ModLoad imudp
-
Add the following lines:
- $ModLoad imfile # Load the local log reader #
- $InputFileName /tmp/static_file.log # This is the location of the log to read #
- $InputFileTag staticlog
- $InputFileStateFile staticlog
- $InputRunFileMonitor
- $InputFilePollInterval 10 # Check the file for changes every 10 seconds #
-
Ensure security measures do not block inbound or outbound traffic. IPTables/Firewalld/etc firewalls will need to have a rule added to permit UDP 514 in and
TCP 1999 out. SE linux/App Armor/etc process execution monitors will also have to be adjusted to permit the actions of rsyslog. For specific instructions,
check manuals for the features you have enabled.
-
Start rsyslog. It would be advisable to enable rsyslog to start at the time of boot as well as a service monitor to ensure it can restart automatically.
-
For specific instructions, check manuals for the distribution you are using.
sudo service rsyslog start OR systemctl start rsyslog
-
Check the status with service rsyslog status OR sudo systemctl status rsyslog
# systemctl status rsyslog
â rsyslog.service - System Logging Service
Loaded: loaded (/usr/lib/systemd/system/rsyslog.service; enabled; vendor preset: enabled)
Active: active (running) since Sat 2018-02-03 13:27:02 EST; 2 days ago
Docs: man:rsyslogd(8)
http://www.rsyslog.com/doc/
Main PID: 22663 (rsyslogd)
CGroup: /system.slice/rsyslog.service
ââ22663 /usr/sbin/rsyslogd -n

Feb 03 13:27:02 localhost.localdomain systemd[1]: Starting System Logging Service...
Feb 03 13:27:02 localhost.localdomain rsyslogd[22663]: [origin software="rsyslogd" swVersion="8.24.0" x-pid="22663" x-info="http://www.rsyslog...] start
Feb 03 13:27:02 localhost.localdomain systemd[1]: Started System Logging Service.
Feb 04 03:25:01 localhost.localdomain rsyslogd[22663]: [origin software="rsyslogd" swVersion="8.24.0" x-pid="22663" x-info="http://www.rsyslog...s HUPed
Hint: Some lines were ellipsized, use -l to show in full.
-
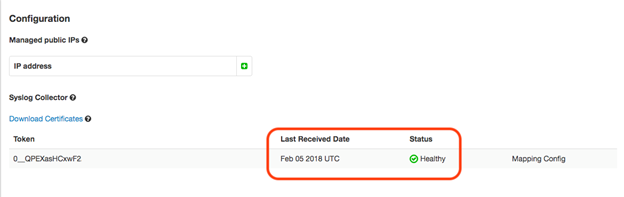
Verify logging is being received by Forcepoint Data Security Cloud | SSE. Login to the portal and navigate to Discovery. At the bottom of the
page, you will see a status for streaming logs that updates every 15 minutes.
-
Once the first logging is received, mapping will be required to identify which columns match source/destination IP addresses. If assistance is needed, contact Forcepoint Data Security Cloud | SSE Support.