Reviewing ZTNA logs
The ZTNA logs page is where all the agent based and agentless ZTNA events by the end-users are displayed.
You can access the ZTNA logs page by navigating to . Log data is kept for 30 days. The ZTNA logs page displays 50 entries per page and 10000 entries in total.

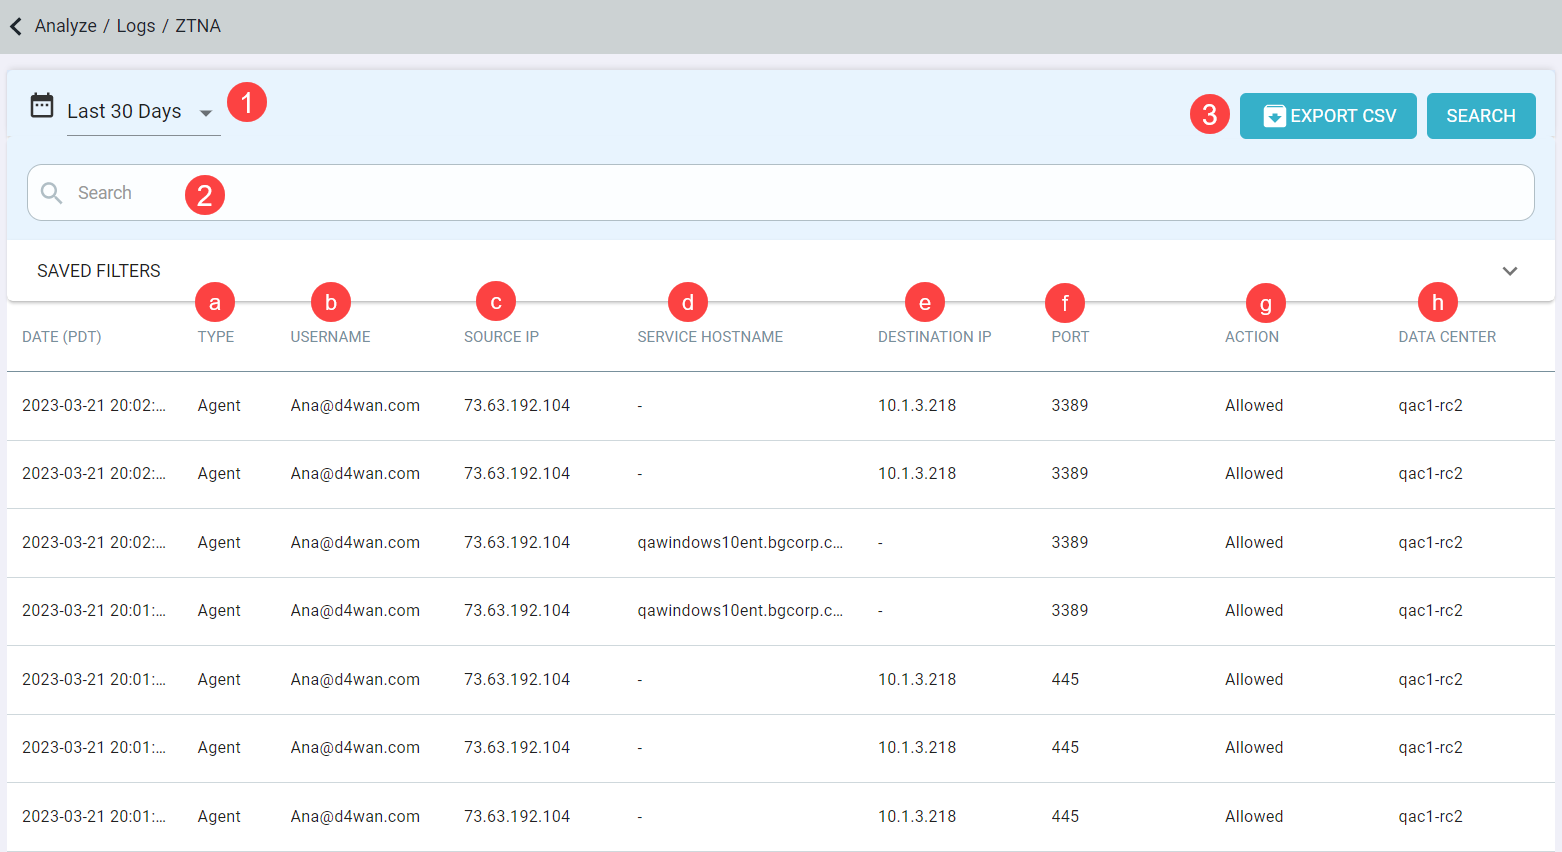
- Time filter: Allows you to filter the logs for selected period.
- Last 24 Hours (default)
- Last 7 Days
- Last 30 Days
- Custom
When you select Custom, you should select Start Time and End Time and click Apply to view logs for selected period. You can view logs for a maximum period of 30 days from today.

- Search: Will allow you to configure and filter the logs by any of the columns displayed. See below for information on each of these columns.
- Type: Displays the type of ZTNA through which data is relayed.
- Can be filtered by equals or not equals and then select Agent to filter the data for agent-ZTNA or Agentless to filter the data for agentless ZTNA.
- Username: Displays the user's Forcepoint Data Security Cloud | SSE username.
- Can be filtered by equals, not equals or contains and then entering characters or the username.
- Source IP: Displays the devices IP address that the user was using for the event.
- Can be filtered by equals, not equals or contains and then entering the IP or numbers.
- Service Hostname: Displays the name of the host that is being accessed. This field is displayed only if the user has accessed the application or service
using the hostname.
- Can be filtered by equals or not equals and then entering the name of the host.
- Destination IP: Displays the name of the host IP address that is being accessed. This field is displayed only if the user has accessed the application or
service using the host IP address.
- Can be filtered by equals or not equals and then entering the Destination IP of the host.
- Port: Displays the port number through which application or a service is being accessed.
- Can be filtered by equals or not equals and then entering the Port number.
- Action: Displays the Action taken by Forcepoint Data Security Cloud | SSE. Valid actions are Allowed and
Denied.
-
Can be filtered by equals or not equals and then entering the Action: Allowed or Denied.
-
- Data Center: Displays the datacenter through which application or service was accessed.
- Can be filtered by equals or not equals and then entering the Data Center name.
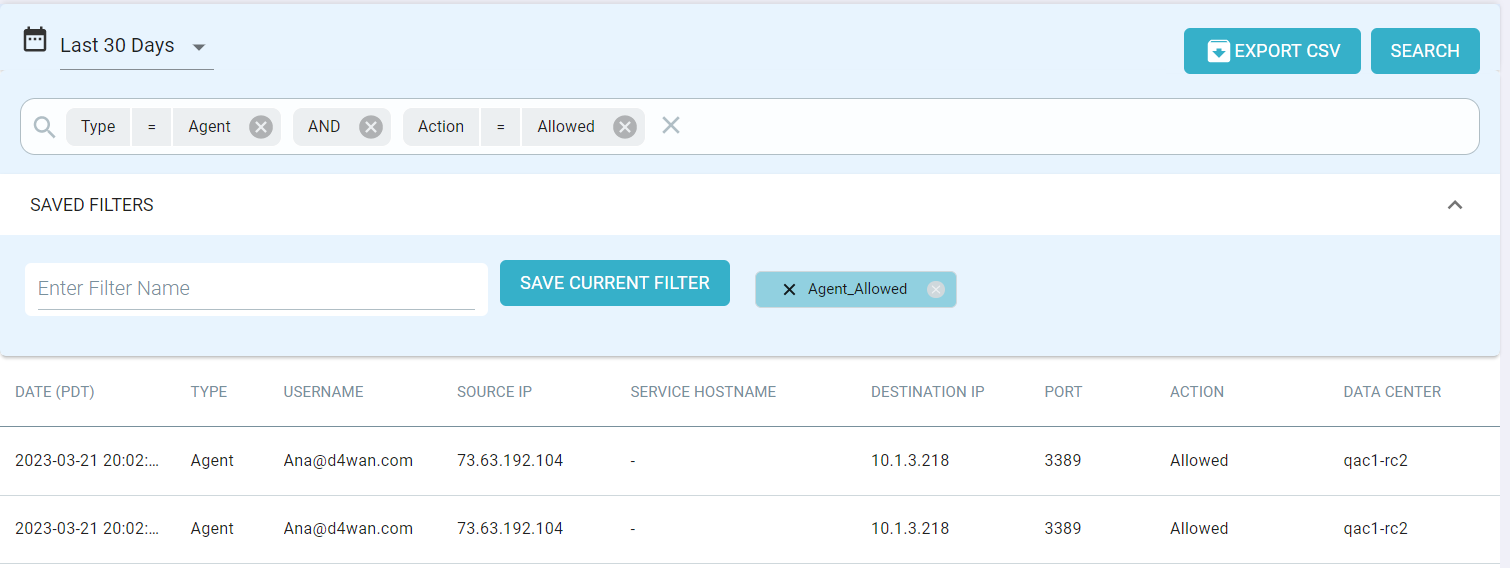
You can create and save filters as needed. For example, following image shows Type = Agent and Action = Allowed.

- Type: Displays the type of ZTNA through which data is relayed.
- Export CSV: After applying required filters, you can click Export CSV to export filtered logs in a zipped csv file. The CSV file contains latest 25000 records with all the fields.
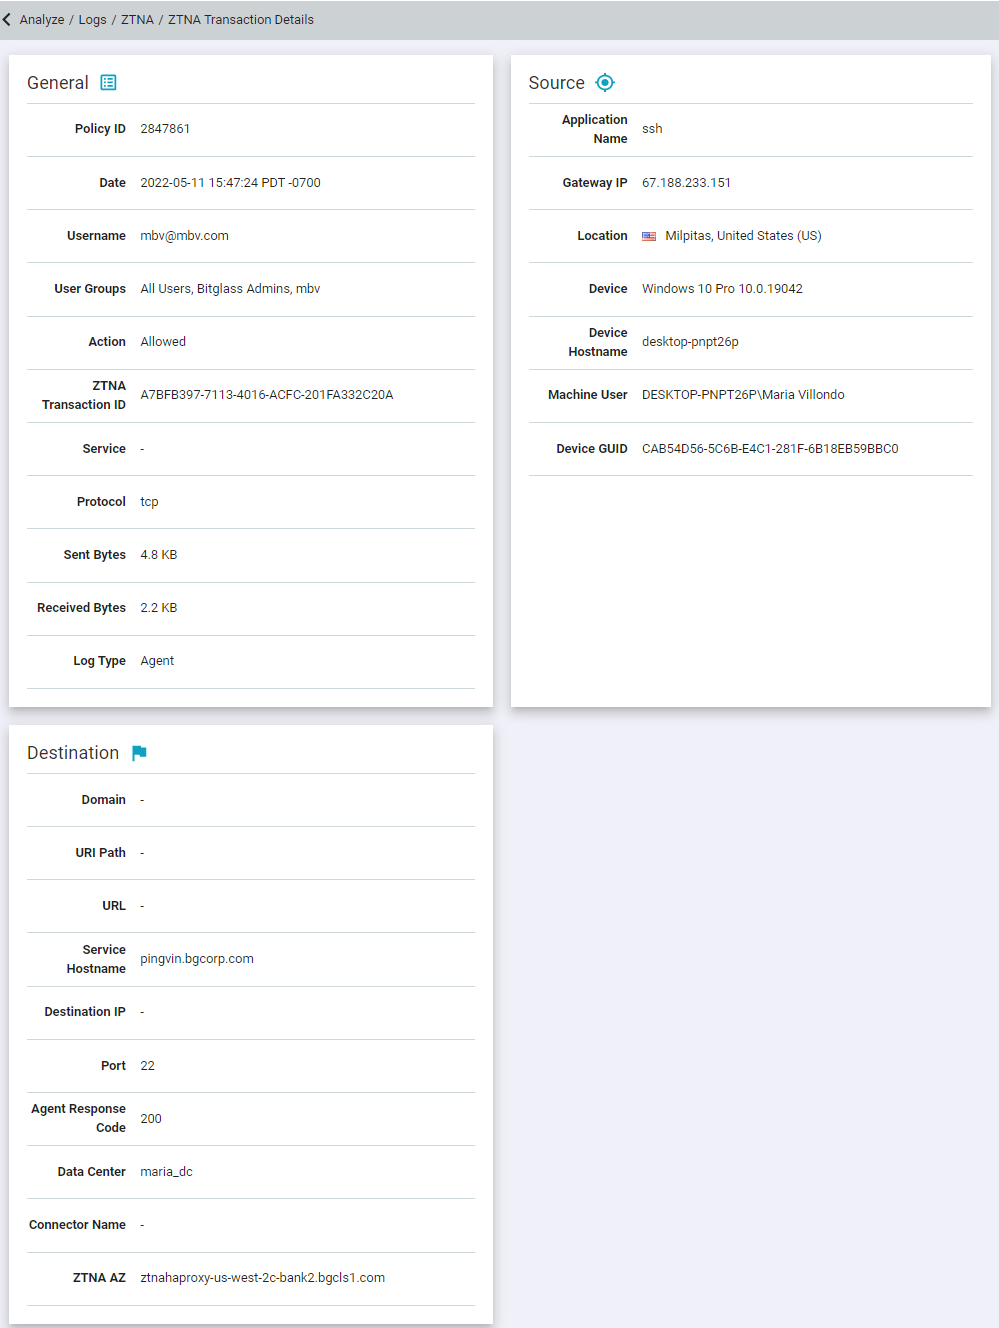
- Clicking into an event log line will take you to a details page providing further information about the event including information such as the TCP request transaction being made (log
type), bytes being sent/received, further information about the user's device (that is, hostname), as well as more detailed information drawn from the app or site being accessed.
