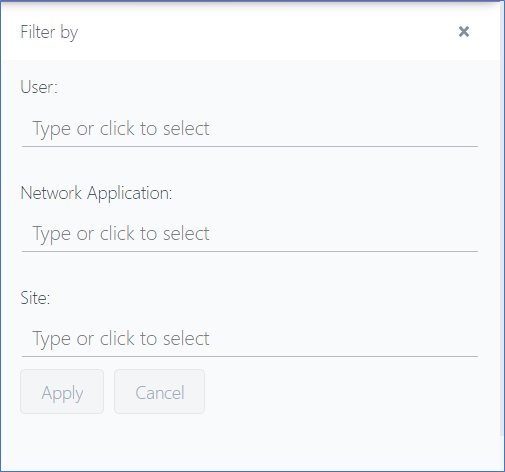
Dashboard filters

You can use the Filter to customize the data that is displayed on the Dashboard or Logs page.

Do the following to customize the data that is displayed in the Dashboard or in the Logs page:

Steps

  1. From the Navigation page, click Dashboard to navigate to the Dashboard page.
  2. Click the Filter button. The Filter By panel is displayed.

  3. Type or click in one or more fields in the Filter By panel to select the information by which to filter the dashboard data.

  4. Click Apply to apply the filter or Cancel to discard the changes.
    Note:
    1. To remove individual filters, click x on the filter element that is displayed at the top of the dashboard, or to remove all filters, click Clear all.
    2. Any filter you apply on the Dashboard page is also applied to the Logs page when you click View Logs.

    Filter By panel field details:

    Table 1.
    Field Description
    User Select a user to display traffic summary only related to that user.
    Network Application Select a network application to display a traffic summary only related to that application.
    Site Select a site to display traffic summary only related to that site.
    Action (Logs page) Select an action to display records for that action:
    1. Allow: Transactions where the request was permitted.
      Note: Access requests that were permitted with a Continue inspection rule may have subsequently been blocked by a threat inspection policy.
    2. Block: Transactions where the request was blocked by an access control rule or by a threat inspection policy.

    This filter is only available on the Logs page.

    IP Address (Logs page) Enter an IP address to display records that include that IP address. Wildcards are not supported. This filter is only available on the Logs page.