Dashboard
The Dashboard displays a summary of firewall activity for a time period.
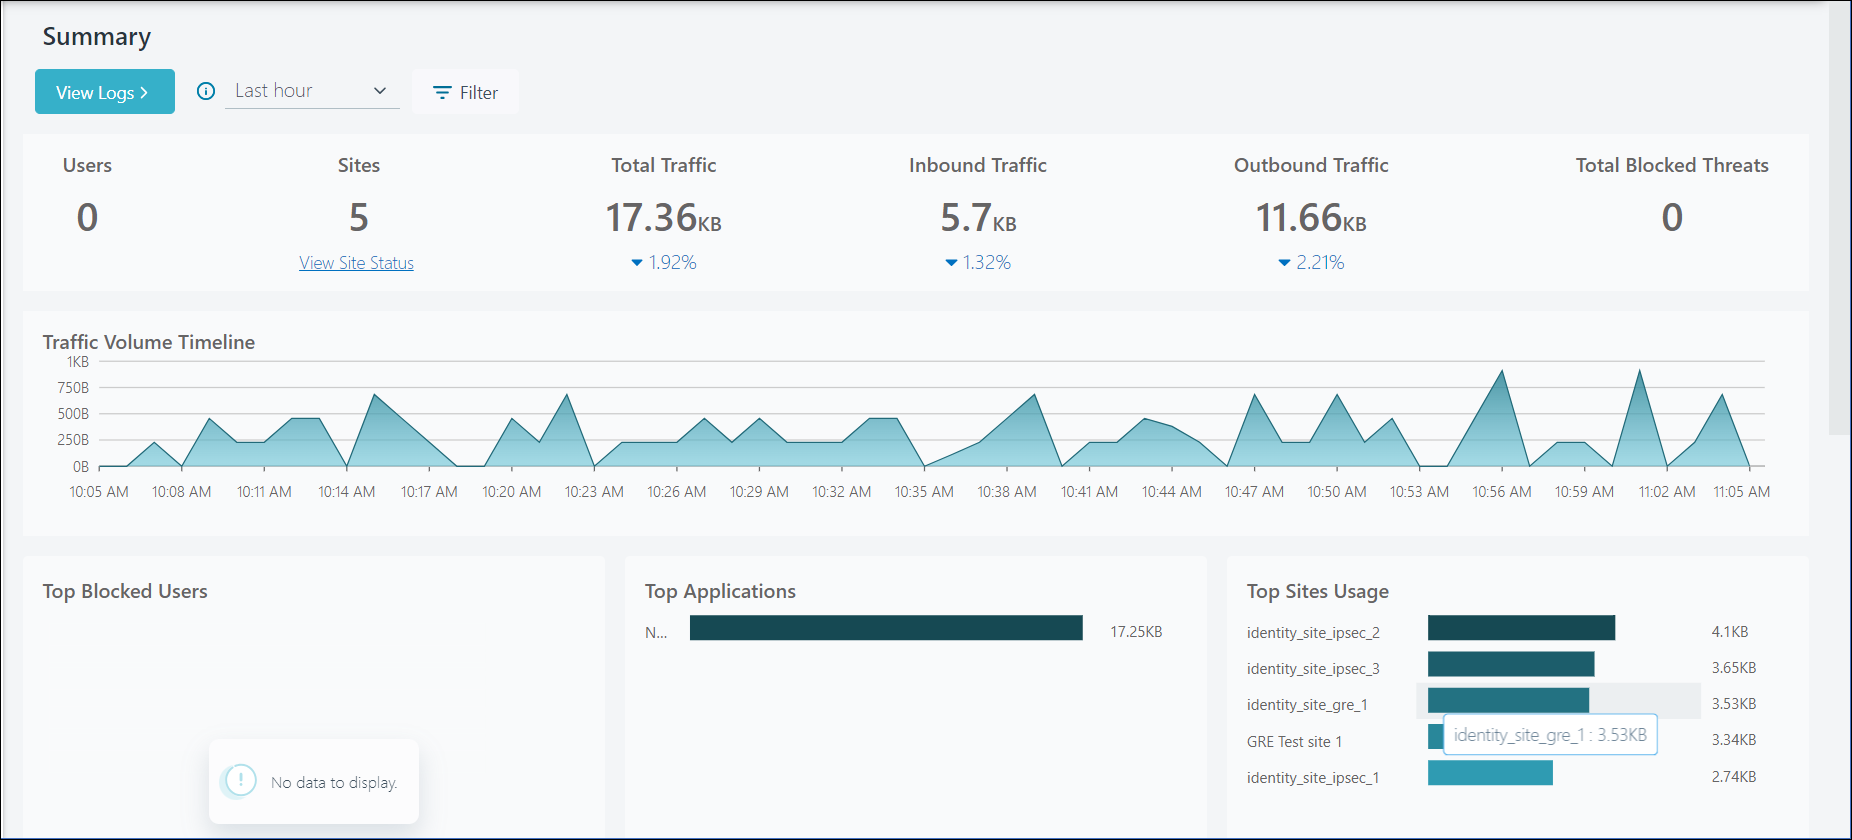
Click Filter to customize the data that is displayed on the Dashboard.
Note:
- If you click View Logs the filter is applied to the Logs page.
- If you use the Navigation pane to navigate to the Logs page, the filter is removed.
Use the time period drop-down menu to change the reporting period to the last 24 hours, 7 days, or 30 days. By default, data is displayed for all traffic, for the past 1 hour.
Click View Logs to view detailed log information for the information that is displayed in the Dashboard.
| Panel | Description |
|---|---|
| Users | Displays the total number of active users. |
| Sites | Displays the total number of active sites or hosting locations. |
| Total Traffic | Displays the total amount of traffic (inbound and outbound) that are routed through the service. |
| Inbound Traffic | Displays the amount of inbound traffic that are routed through the service. |
| Outbound Traffic | Displays the amount of outbound traffic that are routed through the service. |
| Total Blocked Threats | Displays the total number of threats that are blocked. |
| Panel | Description |
|---|---|
| Traffic Volume Timeline | Displays information about the variation in traffic volume for the selected time period. |
| Top Blocked Users | Displays information about the number of blocked requests for the top 10 users. |
| Top Applications | Displays information about the total traffic for the top 10 applications |
| Top Sites Usage | Displays information about the total traffic volume for the top 10 sites. |
| Blocked Threat Timeline | Displays information about the variation in blocked threat for the selected time period |
| Blocked Threat Traffic by Severity | Displays percentage of blocked traffic requests per threat category in a Pie chart. |
| Top Blocked Threats | Displays information about the top 10 blocked threats. |