Logs
The Logs page displays detailed log information for the information displayed on the Dashboard summary page.
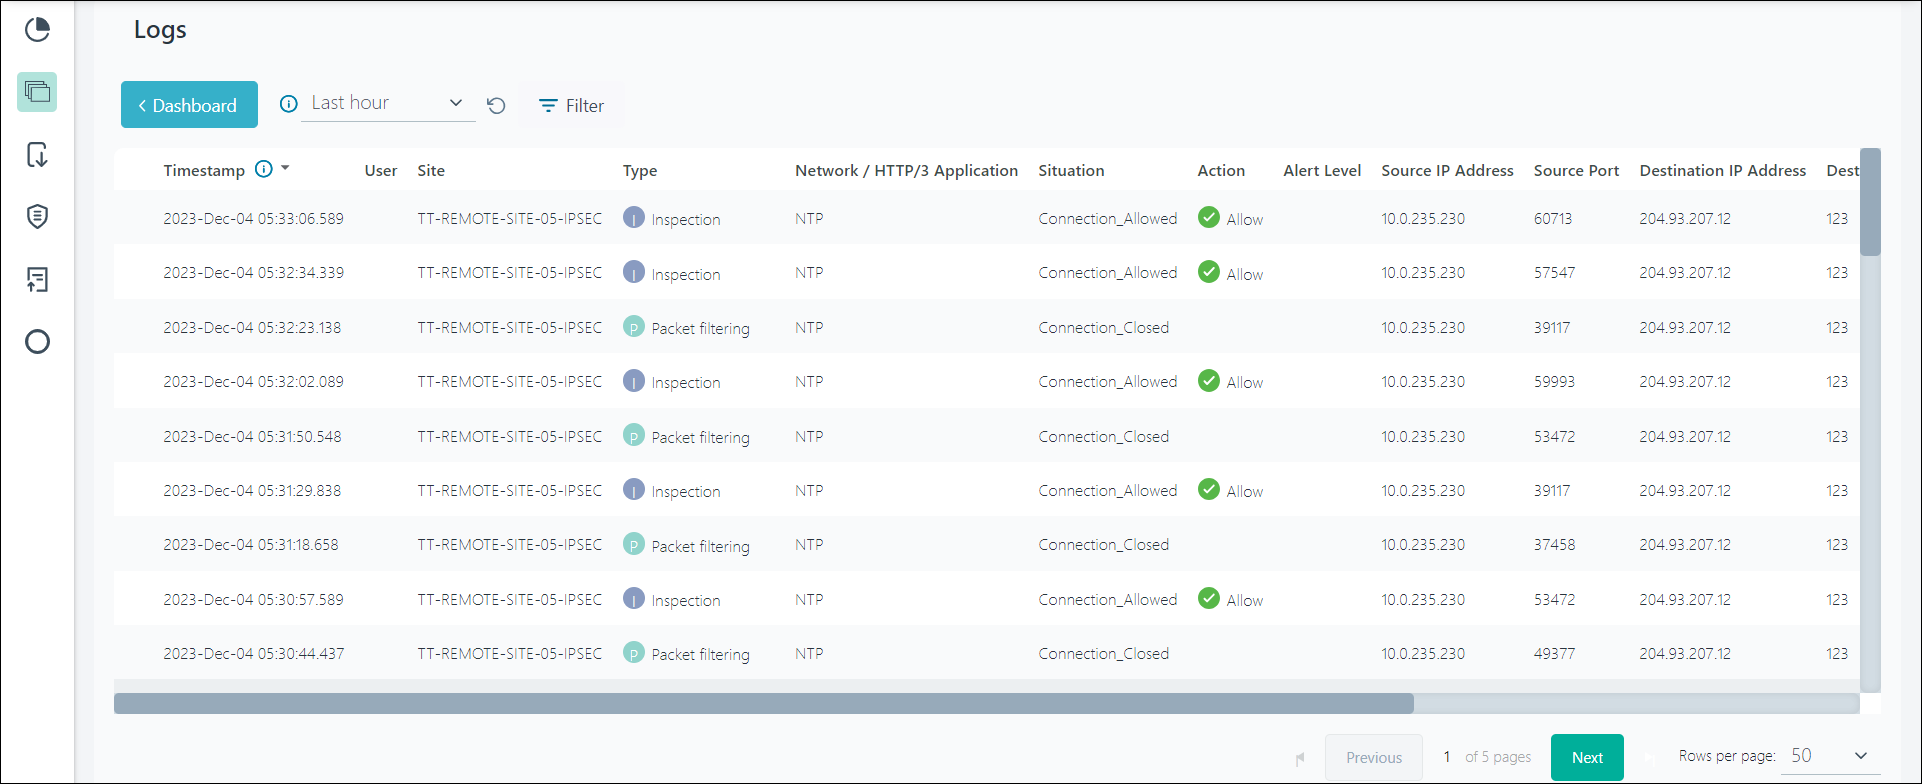
The selected filters and time period is carried over from the Dashboard page to the Logs page.
Note:
- If you click the View Logs button in the Dashboard page, then only the selected filters are applied to the Logs page.
- If you use the Navigation pane to navigate to the Logs page, the filter is removed.
- In the Logs page, you can only view 10000 log entries. You must export the logs to view the complete log entries for the last 30 days. For more details about exporting logs, refer to the Log Export and the AWS Access Key and Secret Key topics.
For more information on how to use Filters and Time period drop-down menu, refer to the Dashboard filters and Time period drop-down menu topics, in the Forcepoint ONE | Firewall online help documentation.
You can navigate to the Logs page by using one of the following ways:
- From the Dashboard page, click the View Logs button.
- On the Navigation Pane, click Logs.
Also, you can do the following in the Logs page:
- To view the latest logs, click the Refresh (
 ) button.
 - To navigate to a specific logs page either click the Previous button or the Next button, or enter the page number in the Go to
page text box and press Enter.

- To configure the number of rows to display in the logs table, select an option from the Rows per page drop-down list. The following options are available:
- 50
- 100
- 150
| Column | Description |
|---|---|
| Connection Event Type |
The title of the logged service event. Values include:
|
| Timestamp | Time when the event record is created. |
| User | Name of the user associated with the event. |
| Site | Site that is associated with the event. |
| Filtering/Inspection | Type of event recorded. |
| Source IP Address | Connection source IP address. |
| Source Port | Connection source protocol port. |
| Destination IP address | Connection destination IP address. |
| Destination Port | Connection destination protocol port. |
| IP Protocol | Protocol that is associated with the event. |
| Conn. Elapsed time (sec) | Elapsed time of connection in seconds. |
| Sent Bytes | Number of bytes sent during connection. |
| Received Bytes | Number of bytes received during connection. |
| Action |
The action applied by the service:
|
| Network / HTTP/3 Application | Network / HTTP/3 application that is detected in the connection. |
| Log Severity |
Indicates the type of log event. Values include:
|
| Rule Name | Name of the policy rule that is created by the Admin. |
| Situation | Traffic signature pattern that is identified by the service. |
| Situation Severity | Severity of the situation:
|