Viewing Discover page
Use the Discover page to query data and create your own widgets, which you can then add to your custom dashboards or use as standalone reports.
On the left pane, click the  icon to open the Discover page. The
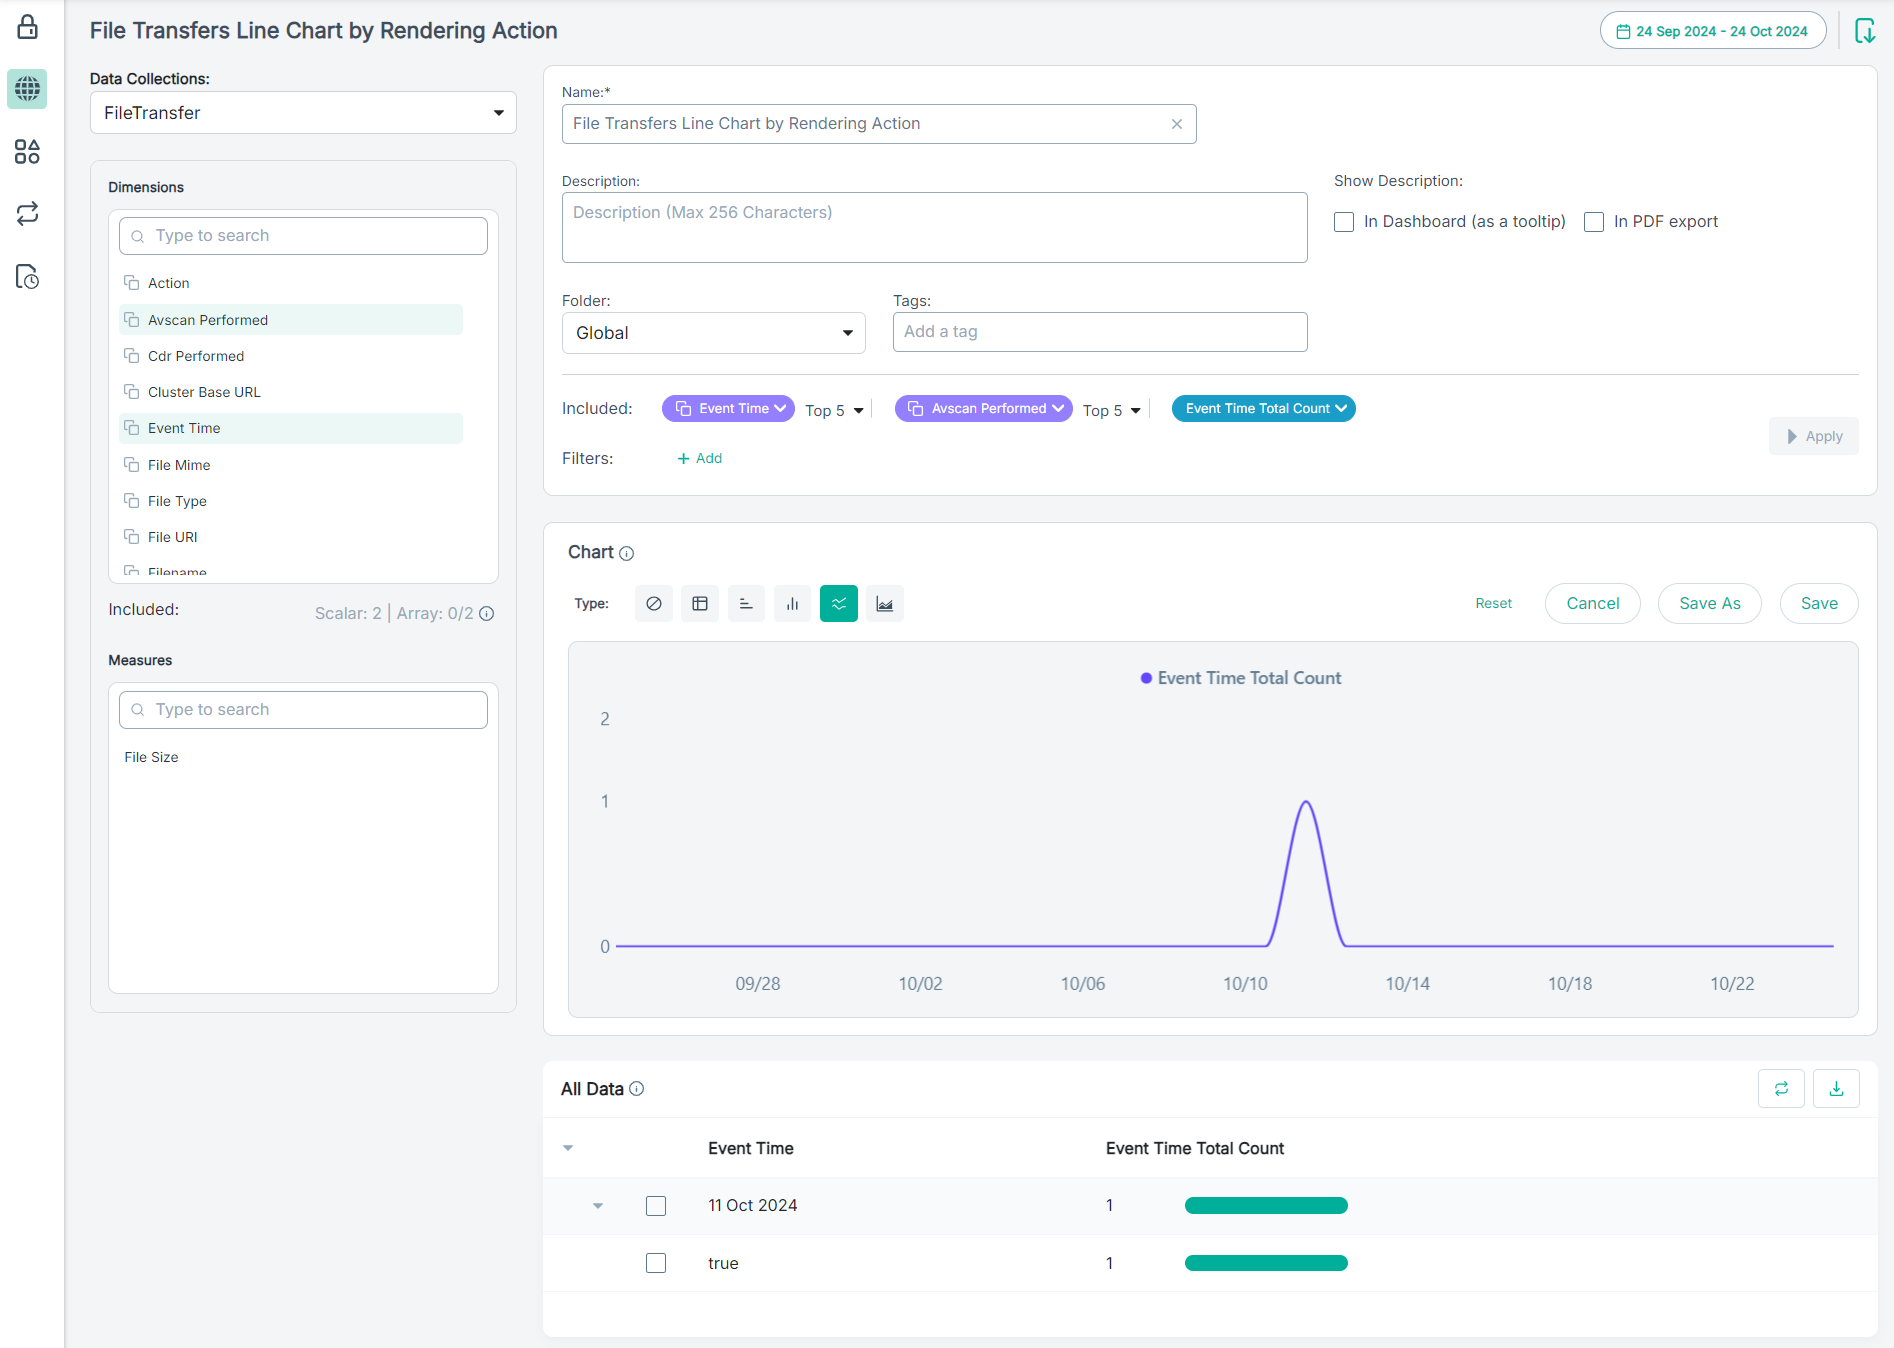
Discover page enables you to define the visualization on how the data should be displayed on your widget. You can do the following:
- Select data collection (data source), appropriate dimensions, and measures required to build the widget.Note: Insights provides support for array type dimensions. You can select up to two dimensions of array type for your widget.
- Based on the dimensions and measures selected, you can select one of the chart types from the Chart section to visualize the data.
- Add a name and description for your widget and then save it to appear in the Widget Catalog.
- Assign a folder for the widget to be displayed in the Widget Catalog. By default, it is assigned to the Global folder.
- Choose to display the widget description as a tooltip on the dashboard and include it in the PDF export when using the widget as a standalone report.

On the Widget tab of the Catalog page, when you click a widget, Insights opens the Discover page for
the selected widget.
Note: You can sort data, control the number of entries, rearrange the order of dimensions and measures, apply filters, change the report time frame, and
view data reports in different charts. To modify data or save the widget details, you must click Edit.