Modifying an existing widget
You can modify the details of an existing widget using the Edit option in the Discover page to update the widget or save it as a new widget.
Steps
-
On the left pane, click the
 icon.
The Catalog page opens displaying the Dashboards tab details.
icon.
The Catalog page opens displaying the Dashboards tab details.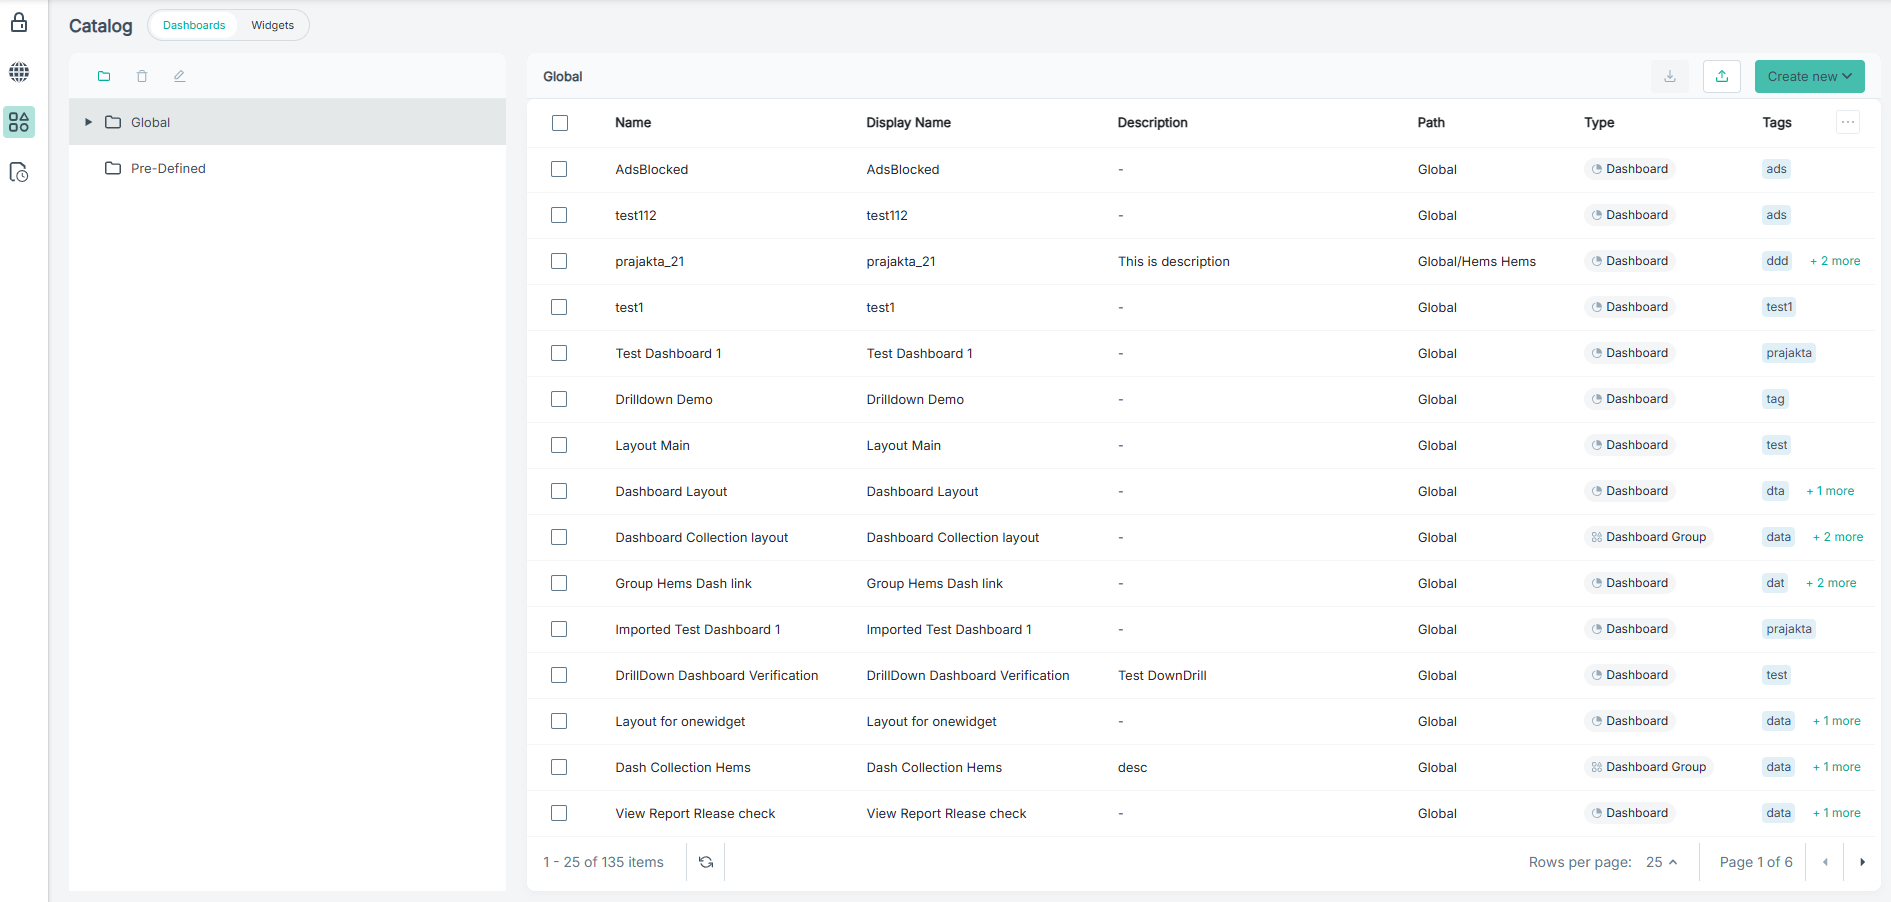
-
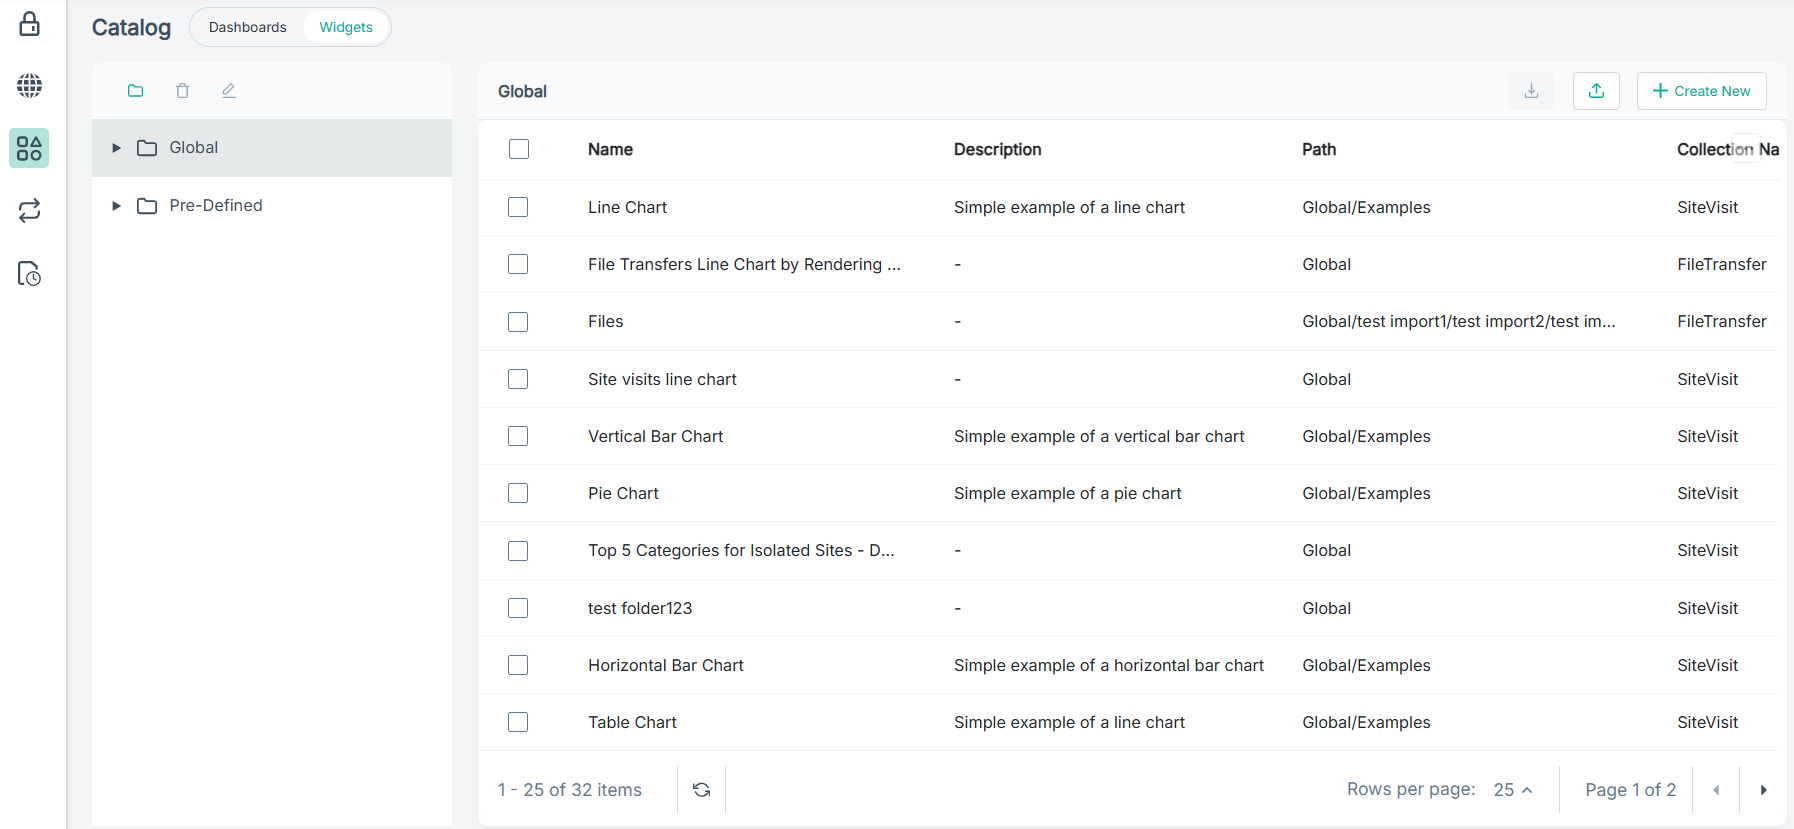
To view the widgets, click the Widget tab.
-
To view the widget details, click the widget report.
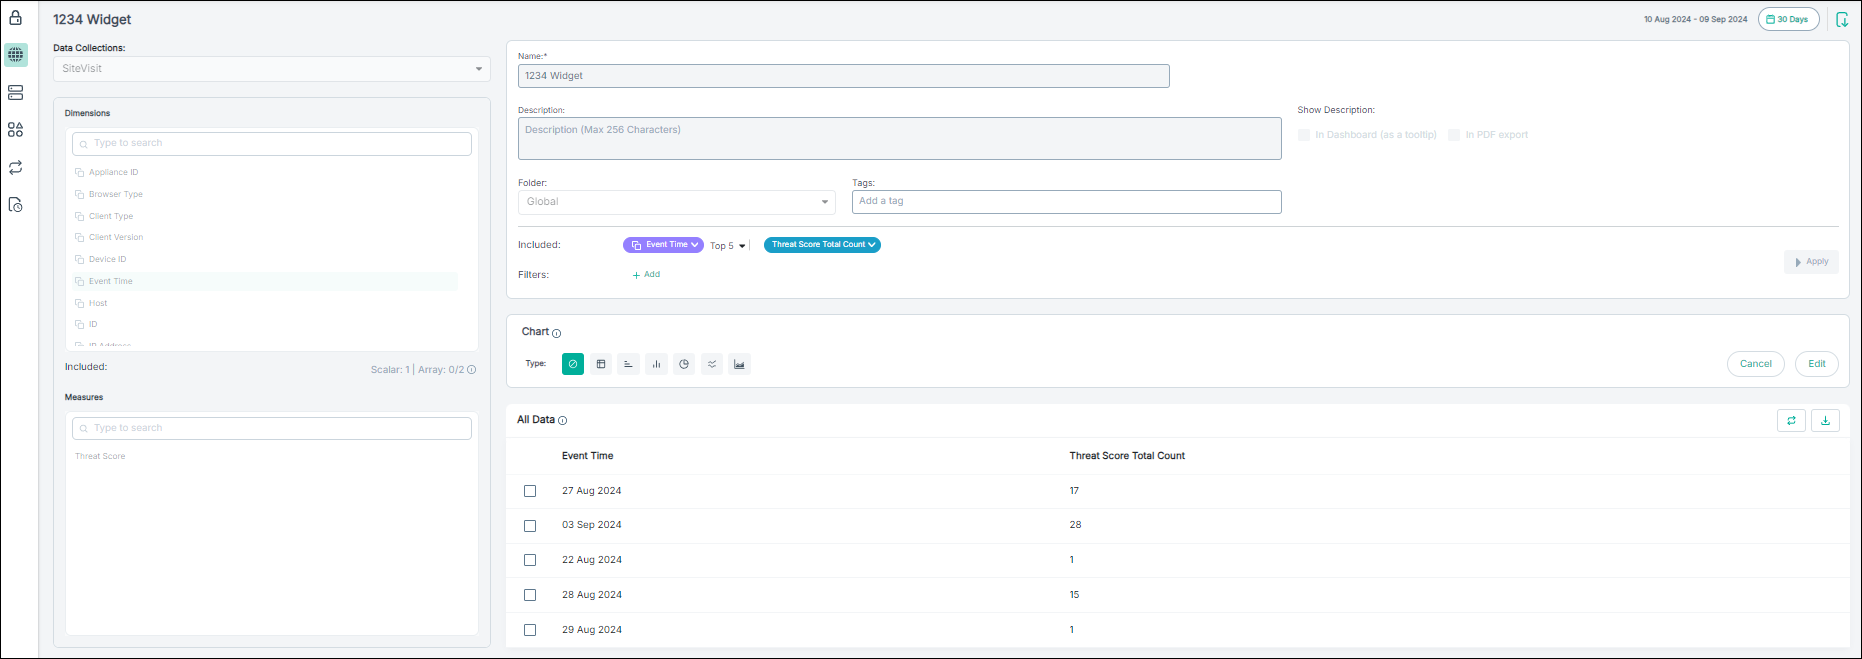
The Discover page opens displaying widgets details (name, description, dimensions, measures, filters, and sorting applied on the widget) in view only mode.
-
Adjust the report time frame for your widget.
-
If you have selected the Custom Range option, then:
- To select a From date for your transaction view, enter a date or select the date from the calendar and then click the time icon to select the time range.
- To select a To date for your transaction view, enter a date or select the date from the calendar and then click the time icon to select the time range.
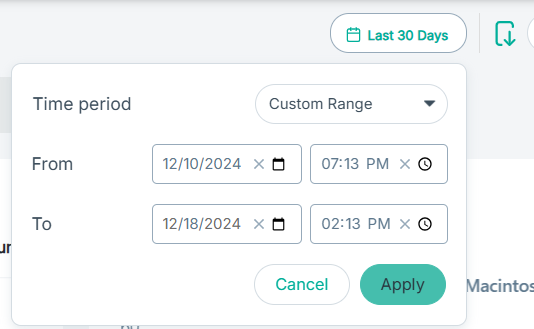
Note: The date and time formats are the same as those configured on your system.
-
If you have selected the Custom Range option, then:
-
Do one of the following:
- To remove the changes, click Reset.
The Reset option is enabled only if you have made any changes.
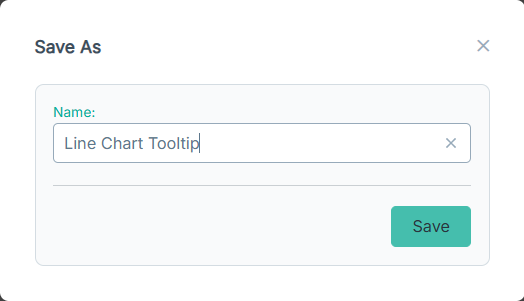
- To save a duplicate of the widget, click Save As.
The Save As dialog opens where you can create a name for your duplicate widget.
- To save the changes made to widget, click Save.Note: The Save option is available only for custom widgets.
The updated widget appears in the assigned folder on the Widget tab of Catalog page. You can use these widgets as standalone reports or when configuring custom dashboards.Note: A widget saved without a selected chart cannot be added to a dashboard. - To remove the changes, click Reset.